

Licenses
When installing the RPI server, you must specify a valid license. A valid license:
-
Was issued to the organization for which the RPI server is to be installed.
-
Was created using the license machine code of the machines upon which RPI is to be installed (see below).
-
Is perpetual or is scheduled to expire in the future.
-
Is not constrained by application version or is constrained by the current application version or a higher version number.
If you attempt to install using an invalid license, the “Validate the application license file” check in the core Pre-Install Checklist will fail, and you will not be able to proceed with the installation.
This applies also when upgrading the RPI server to a new version.
When you try to connect your RPI client to a licensed server, you will be able to access functionality as expected if:
-
The server has a perpetual license or the license’s expiration date is greater than today.
-
The license is not constrained by server application version or is constrained by an application version that is greater than or equal to the current server version.
If these conditions are not met, your RPI client will still run; however, you will not be able to access any tasks therein.
If a server license expires, you can upload a new, valid license file in the Plugins tab. When you do so, the new license will be installed automatically. You will then be able to access RPI functionality as required. Note a license must be more recent than the original to be uploaded in this way.
Note that the number of cluster nodes and clients can be constrained using parameters passed during the generation of an RPI license. In event of such constraints being in place, you will be unable to increase the number of entities in question beyond the limits defined by the license.
Note also that knowledge of target servers’ license machine codes—details of which are recorded in a number of places throughout this documentation—are essential to the generation of RPI licenses. If charged with responsibility for this task, ensure that you have access to each machine’s code during the generation process. Note that a server’s machine code can be discovered using the utility provided at:
Deployment Files\Utilities\MachineCodeUtility\RedPoint.Resonance.MachineCodeUtility.exe
Running this application from a command Window will display the current server’s machine code.
Interaction Server Maintenance
This section is intended for operations staff charged with the responsibility of managing an RPI server installation.
For detailed information on the RPI Operations Interface, please see the interface’s User Guide.
Architecture Summary
Full details of the RPI architecture can be found in the Technical Architecture document.
RPI Services
The RPI application server consists of one web and two Windows services.
|
Name |
Type |
Description |
|---|---|---|
|
Interaction API Service |
Web service |
Facilitates communication with RPI databases and Windows services. |
|
Node Manager |
Windows service |
Assigns nodes’ workload and performs node upgrades. |
|
Execution |
Windows service |
Hosts the execution of Interaction workflows; runs scheduled or periodic background system tasks such as housekeeping and fulfillment tracking. |
If the SQL Server upon which an RPI service depends is not available (for example, due to the MSSQLSERVER service being stopped) when the service starts, the service continues running and polls for SQL Server availability, rather than shutting down. An event log entry is written advising that the service was unable to start properly due to SQL’s unavailability.
On starting the SQL service, the RPI service starts after approximately one minute, and an event log entry is written advising that the service started.
Interaction API Service
All user requests to the server are handled by the Interaction API service.
The status of any of the Windows services has no bearing on the user’s ability to log in to the system.
All requests to the Interaction services are made using HTTPS. A valid certificate must be installed on the application server and the service must be configured to use it.
The service should run under an application pool that uses the .NET Framework (v4). The application pool should be running as a Windows/domain user with access to the file system on the application server and access to the data warehouse and operational databases.
If users experience issues logging in, it is recommended to ensure that the Interaction API website can be navigated to in a browser. Its URL is of the format: https://[server][:port (optional)]/Interaction
The service has a web.config file. This file allows changes to be made to database connections, and logging configuration.
If you navigate to the RPI Interaction API Home Page, you can access Swagger documentation, which documents the API endpoints exposed by the Service.
To enable this option, the Interaction API web.config setting EnableSwagger must be set to True:
<applicationSettings>
  <RedPoint.InteractionAPI.Properties.Settings>
    <setting name="EnableOAuth" serializeAs="String">
      <value>True</value>
    </setting>
    <setting name="EnableSwagger" serializeAs="String">
      <value>True</value>
    </setting>
  </RedPoint.InteractionAPI.Properties.Settings>
</applicationSettings>
Execution Service
The Execution Service provides an engine that controls execution of all server-side activities.
The RPI client communicates with the Execution service via the Interaction API web service. Most communication between the Interaction API service and the Execution service is conducted via the Pulse database. The Windows service polls the database regularly to pick up and process the next request.
Workflow instances can be tracked in the Client “Interaction_” database in the table
“op_InteractionWorkflows”. If a scheduled trigger is activated, it is persisted in the table “op_InteractionTriggers”. Once the trigger fires, it creates a workflow instance and a record is inserted into “op_InteractionWorkflows”. Audiences are executed within a workflow instance and are tracked separately within the table “op_DataWorkflows”. These tables contain all the state information reported to the client.
Operational Databases
RPI uses two core operational databases:
The operational databases store information necessary for RPI to function. There are three operational databases:
-
Pulse: the main operational database, Pulse stores details of cluster operational data, such as client jobs, login credentials and system tasks.
-
Pulse_Logging: stores error log records.
Starting and Stopping the RPI Server
For the RPI server to start correctly, it needs access to the operational databases. If the databases are not available when the server is started it will monitor for their availability on a regular basis. Any issues are reported to the Event Log until the databases become available. Once the databases are started, the server completes initialization.
When the server is stopped, it will attempt to pause any active workflows. If any workflow is in a long-term busy state that cannot be paused, that workflow could be damaged by stopping the server. A common scenario would be processing a long-running SQL query. Care should be taken to stop the Execution service when the system is quiet.
Offer History Tables
The Interaction offer history tables are created in the data warehouse when users create audience definitions in the Administration Interface.
The tables created are as follows:
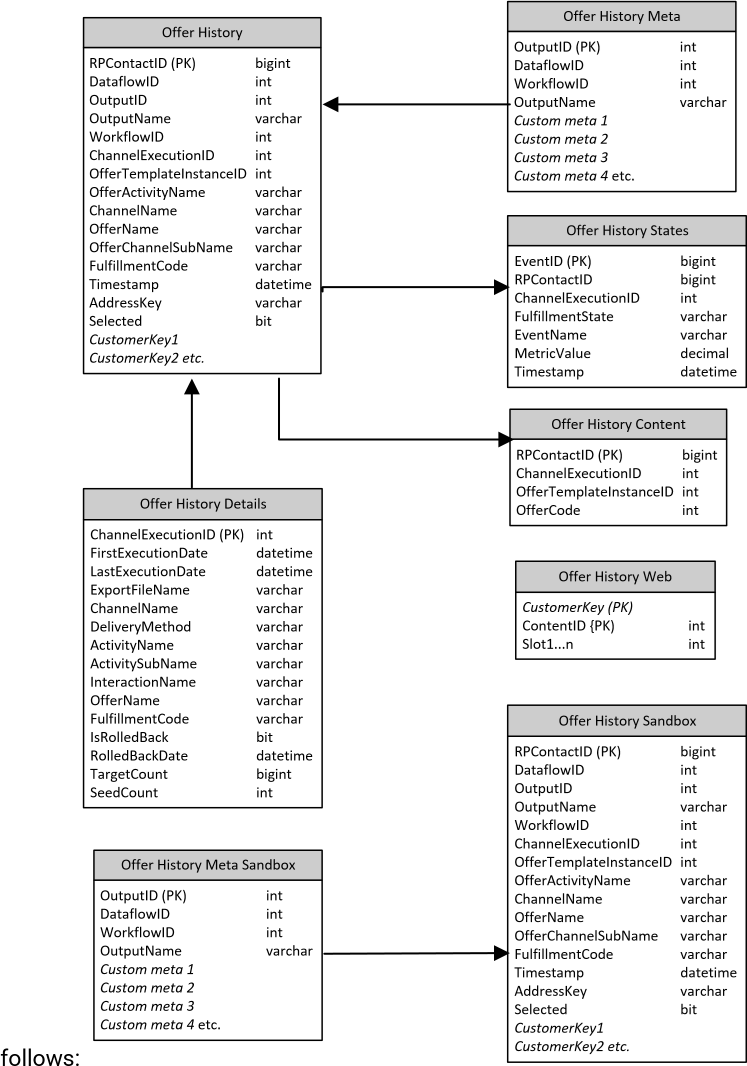
The tables are described below:
Offer History
The main offer history table, which tracks a contact’s audience output membership and the offer received. The keys persisted are configurable at audience definition administration.
Offer History Meta
This table persists audience output cell level metadata. The metadata persisted is configurable as part of the audience definition administration.
Offer History States
Use to track channel specific states or events that are captured post-execution of an offer activity.
Offer History Content
This table tracks the version of an offer sent to an individual. If the offer contains dynamic content, the instance of the content sent to an individual is also tracked.
Offer History Details
This table provides a synopsis of a specific fulfillment activity’s execution (useful for reporting purposes).
Offer History Web
This table stores details of applicable web content following execution of a web offer.
Sandbox Tables
The “sandbox” tables are copies of the Offer History and Offer History Meta tables that are used for testing interactions.
Field Descriptions
The fields referenced in the diagram above are as follows:
|
Field |
Description |
|---|---|
|
|
Unique ID used to track an individual’s receipt of an offer |
|
|
Binds an individual to the instance of the audience used to select them |
|
|
Audience output (offer cell) ID |
|
|
Audience output (segment) name |
|
|
Tracks the workflow instance that ran the activity |
|
|
Tracks the instance of the activity/channel that fulfills the offer |
|
|
The version of offer content sent via the offer activity |
|
|
Name of the offer activity |
|
|
Name of the fulfillment channel |
|
|
Name of the channel-specific activity that executed an element of an offer activity |
|
|
Name of the offer |
|
|
The user-supplied fulfillment code used for planning and reporting |
|
|
The time the record was committed to offer history |
|
|
Any channel specific address key (e.g., Email Address/Cell number) |
|
|
Indicates if the record was sent to a third party channel (accounts for dedupes etc.) |
|
|
The name of the fulfillment state that happened postexecution |
|
|
Additional event information (e.g., URL for Email click through) |
|
|
Any associated value linked to the fulfillment state event |
|
|
The instance of dynamic content sent to an individual |
|
|
Date and time at which activity started execution |
|
|
Date and time at which activity finished execution |
|
|
Name of export file created during activity execution |
|
|
Delivery method of channel through which fulfilled |
|
|
Name of activity |
|
|
Name given to the offer/channel list item when configuring offer activity’s set of channels |
|
|
Name of interaction in which activity executed |
|
|
Flag indicating whether rolled back |
|
|
Date and time of rollback |
|
|
Number of records targeted by fulfillment activity |
|
|
Number of seeds targeted by fulfillment activity |
|
|
Web content’s Published folder ID |
|
|
ID representing content for particular slot to be received by specific individual |
Offer History Queues
The offer history queuing mechanism is designed to minimize the potential for insert contention resulting in the occurrence of blocking at an RPI cluster’s offer history tables.
Two tables in each client’s Interaction_[clientname] database facilitate the queuing mechanism:
-
op_OfferHistoryInsertQueue: this table is used by RPI to temporarily store details of jobs containing records to be inserted into the offer history or offer history sandbox table.
-
op_OfferHistoryInsertConfiguration: this table is used to store details of queues configured in the current RPI installation. If no records are present, the queuing mechanism is not used. A single row in the table represents a single queue. The table contains the following columns:
-
QueueID: the key column, the value for which is auto-generated.
-
TimeoutMinutes: the time for which records are to be maintained in a queue, after which an insert is performed. This timeout defines the maximum length of time that an insert is permitted to hold up a queue before the next job in line is permitted to start inserting records.
-
MaximumInsertSize: defines the limit as to the maximum number of records for a job that can be executed via the queue. This column allows certain queues to be reserved for smaller inserts, minimizing the potential for blocking by larger inserts. If the number of records to be inserted in a job exceeds all available queue limits, the system chooses the queue with the largest MaximumInsertSize. If this column is Null, all jobs may use it.
-
When performing offer history or offer history sandbox inserts, if more than one queue exists, one insert job at each can be executed concurrently. The next job uses the queue with the lowest permissible MaximumInsertSize value. A queue with an appropriate MaximumInsertSize value that has been set will be selected in preference to one where he value has not been set. By adopting this approach, the system retains larger-capacity queues for larger inserts, minimizing the chance that a smaller insert will be blocked by a larger one.
The queuing mechanism is used when executing interaction workflows in both Test and Production mode. It is used when executing control, export and offer activities. A given activity’s results log describes the queue that was used.
Outputting Logs To File
By default, the RPI server application will write the error logs and SQL trace into the
Pulse_Logging and InteractionAudit_xxx databases, respectively. It is also possible to log the information to a text file. Note, the text file will not contain the Client (Tenant ID) and in the case of the SQL trace, will not contain any additional information about the source or the result of executing the SQL.
The file output can be configured in the following .config files
-
\ServicesCommon\ExecutionService.exe.config(Log and SQL trace) -
\NodeManager\NodeManagerService.exe.config(Log and SQL trace) -
\Interaction\Web.config(Log only)
The log message destination is controlled by the <categorySources> section of the config
The Business Error section covers error messages. A new flat file trace listener would be required to direct messages to a file. See the SQL Trace section for an example:
<add switchValue="All" name="Business Error">
  <listeners>
    <add name="Database Trace Listener" />
  </listeners>
</add>
The SQL Trace section is already configured with a flat file trace listener. Change the
switchValue to All to output all messages
<add switchValue="Critical" name="SQL Trace">
  <listeners>
    <add name="SQL FlatFile TraceListener" />
  </listeners>
</add>
The General section allows you gain verbose visibility of all generated log messages
<add switchValue="All" name="General">
  <listeners>
    <add name="Database Trace Listener" />
  </listeners>
</add>
Query Trace Log Retention
The period for which query trace logs are retained can be controlled by updating the
Configuration field in Pulse.op_Housekeepers, for the record with Name 'Audit housekeeper'. The value is set using this format:
<config noOfDays="90" noOfDaysRetentionSQLTrace="28" />
Outputting Logs To New Relic
RPI optionally supports the output of logging information to the New Relic monitoring system. Further information can be found in the separate “Enabling New Relic Logging” document.