One-to-many relationships and flattening out the data
Data denormalization approach
One of the most straightforward approaches to addressing one-to-many (1:M) relationships is to denormalize the data or flatten the data out. Essentially, you are pivoting the data on an id field and generating fields of data for each row of data on the many side of the relationship.
We’ll start with the provider web links table, the many side of the 1:M relationship, and we reduce it to two data fields, link_name and link_value, and use that to illustrate the denormalization of the data.
The modified Provider_Web_Links table is shown below:
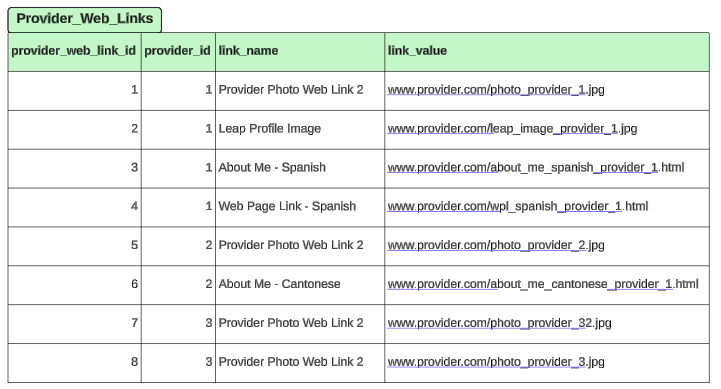
We will denormalize the table to look like the following table Provider_Web_Links_Flattened. The link names will become the field names, and the link value will be the value of the field.
The table would look like this based on the source data above Provider_Web_Links.
Web links table flatten

This approach means that you either need a predefined approach to pivot the data or there are some dynamic ways to do the same thing; depending on the database technology being used, the options may vary. Regardless of the approach you want to evaluate for your scenario, you always want to test the performance of the approach based on your use cases.
Expanded data example
Using the data outlined in the header document, we have an Entity Relationship Diagram (ERD) that looks like the following image and the tables below.
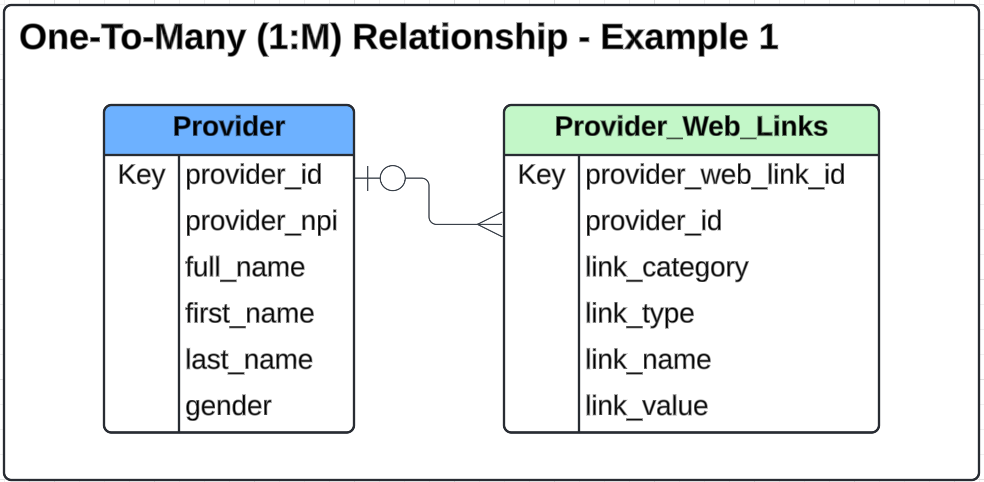
The following are example data sets for each of the tables in the ERD above. That set of data will be used in the detailed feature use cases in this section. An illustration of the data in table format is listed below.
Provider table
The Provider table contains unique records for each provider based on provider_id. There are some additional fields including Personally Identifiable Information (PII) to round out the data.

Provider Table
Web links table
The links table can have many records for a single provider_id and represents the many side of the ERD in support of the features we will illustrate. The column called link_id is the primary key in this table. The reason we included this was to provide a use case where all other fields are duplicated besides the link value. provider_id 3 has two records that are all the same but have different provider_web_link_ids and link_values. They are intended to show what happens when using various features when the data is loaded incorrectly. In those cases, you may not get errors in RPI, but you will potentially get unexpected results. Each of the approaches above will address how this bad data will affect the results or process.
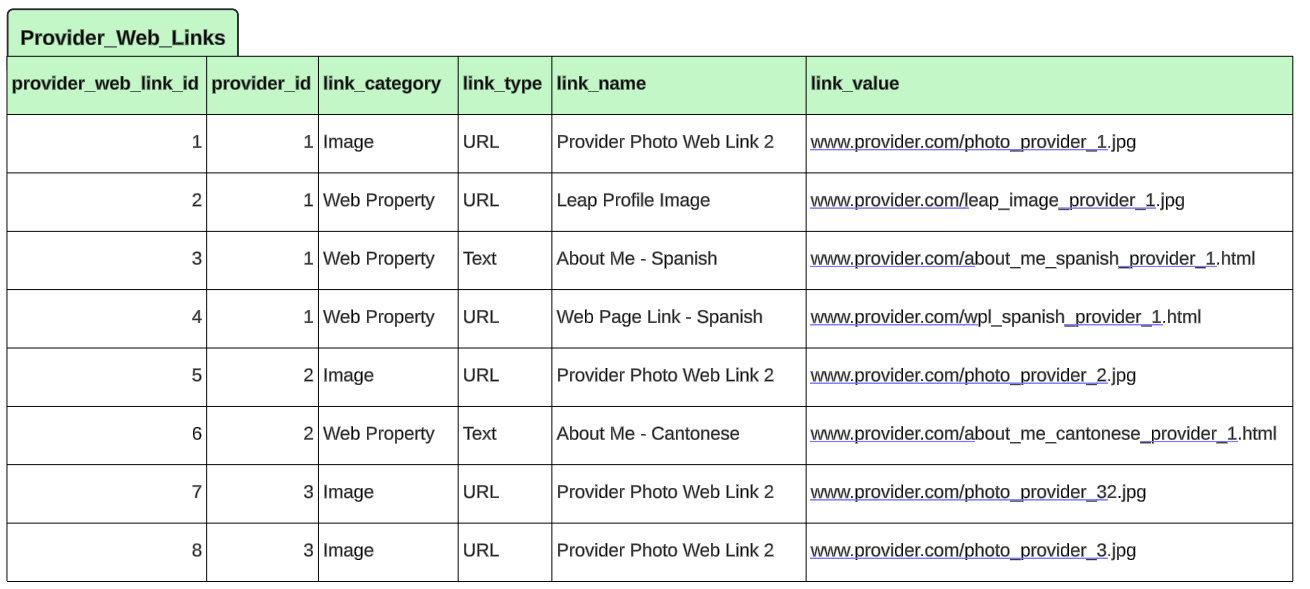
Provider Web Links Table
Flatten web links table
Now the key difference here is that there are more than just a name (key name) and value as a part of each row in the Provider_Web_Links table. This table includes two additional fields: link_category and link_type. Given the additional fields, we have a couple of options: we either need multiple tables of key(field name)/values or we need to have a more sophisticated flattened representation to support the various data elements. We will illustrate both of these options below.
Multiple Tables
One of the options is to create multiple tables to support the data for each of the fields in the many table. There is one key name (link_name) in these tables and three related fields to that key, link_value, link_category, and link_type. So, for this approach, we would need three different tables to represent that data.
Web_Links_Flatten_ValueWeb_Links_Flatten_CategoryWeb_Links_Flatten_Type

Web_Links_Flatten_Value

Web_Links_Flatten_Category

We_Links_Flatten_Type
ERD for multiple tables
This is what the ERD would look like for multiple tables.
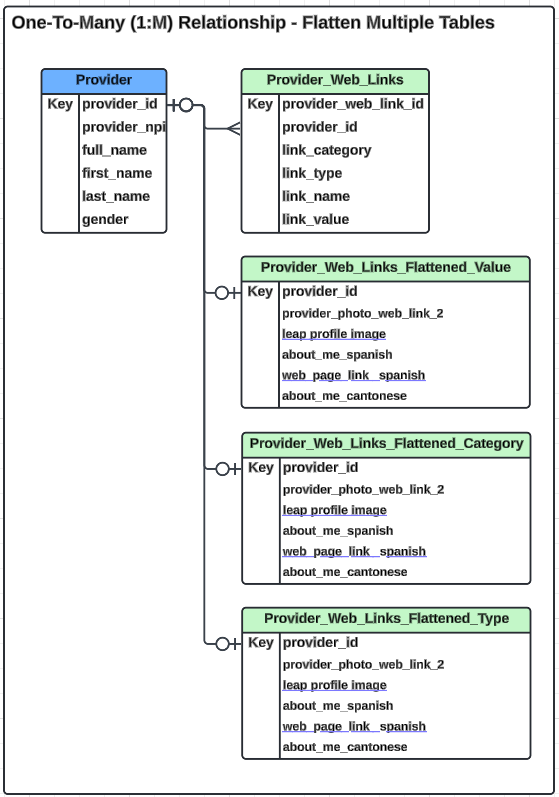
ERD - Multiple Table
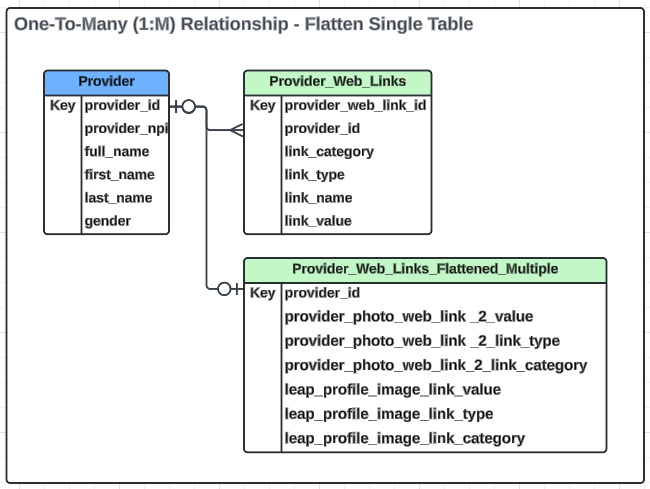
Single table
Another option is to create one table with multiple columns to support the additional fields. We create three columns: link value, link type, and link category for each link name. This is illustrated below.

Single table ERD
This is what the ERD would look like in this example.
Redpoint Orchestration configuration
Now that you have selected an option to denormalize the data, you can configure Redpoint Interaction (RPI) to use the tables and fields. In this example, we will use the simplified single table example from the very top of this document named Provider_Web_Links_Flattened. Any of the other two examples of multiple tables or the other single table would require the same steps; we just want to show the simplest example for this illustration.
Sync catalog: This will allow RPI to see the new tables
Create attributes: Create Attributes from the table in RPI
Create join(s): This will link the Provider table to the new table
Create export template: Create an export template with the attributes from the new table
Validate export template: Validate things are working as expected by creating a selection rule and viewing the data with the export template to validate the results
1. Sync catalog
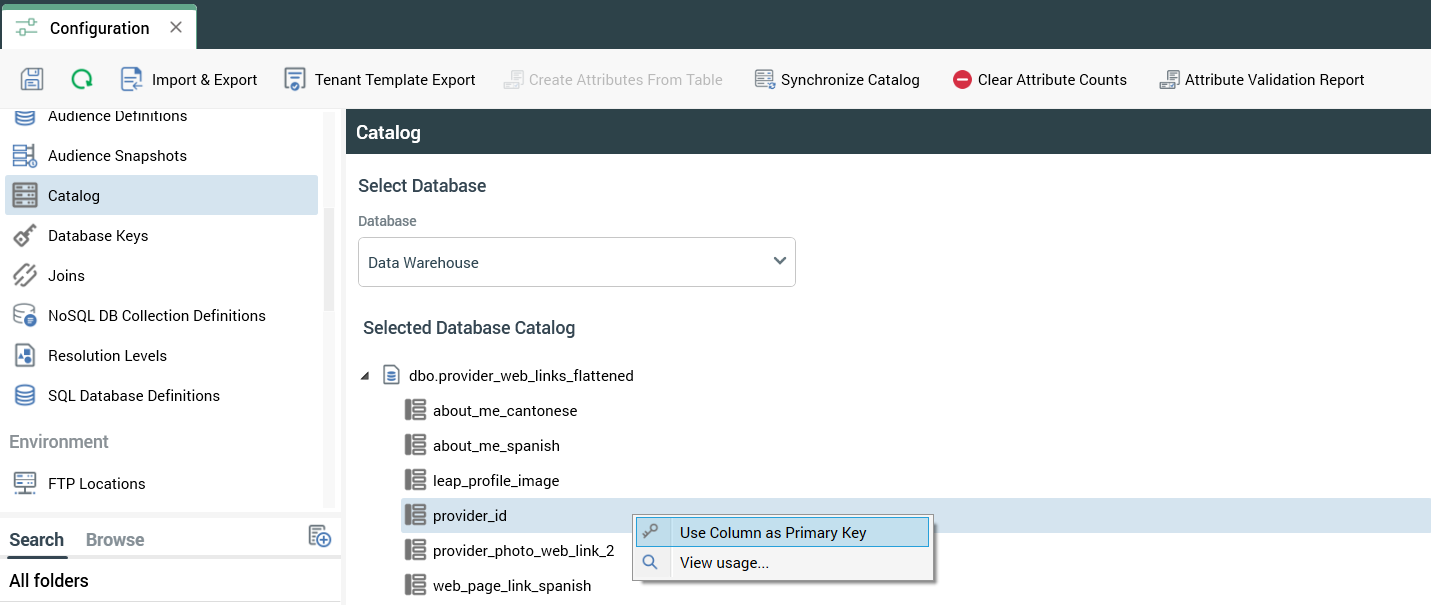
Open RPI and the configuration section and go to the catalog and synchronize the catalog.
Set the primary key to the table if it has not been set and save the catalog.
2. Create attributes from new table
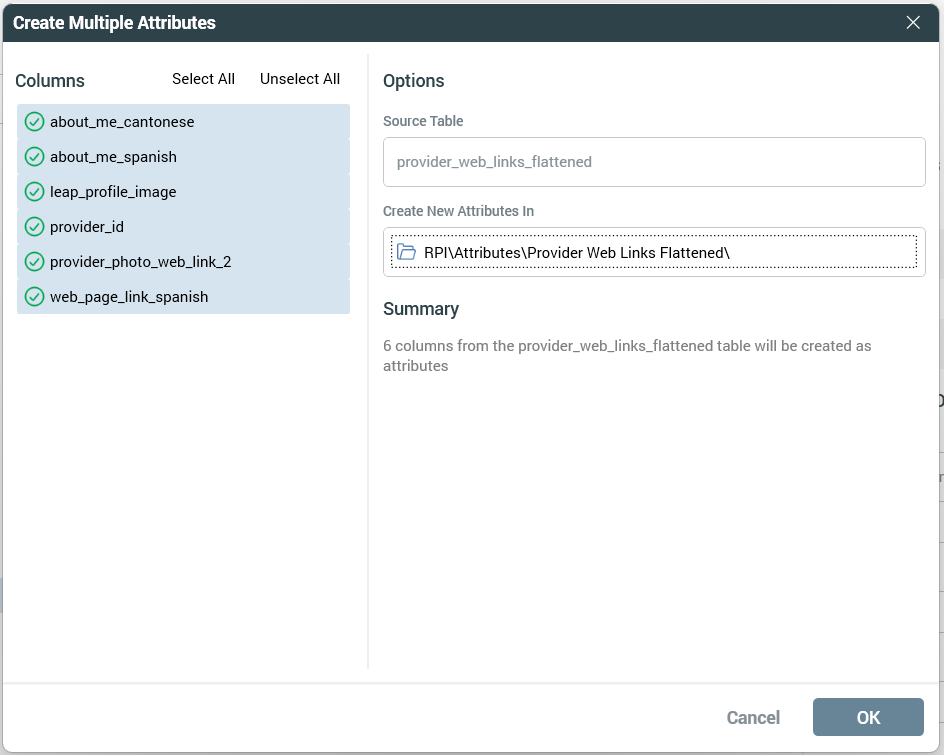
Now from the catalog you can create the attributes from the table.
3. Create join
Now you can create a join from Provider to Provider Web Links Flattened.

4. Create export template
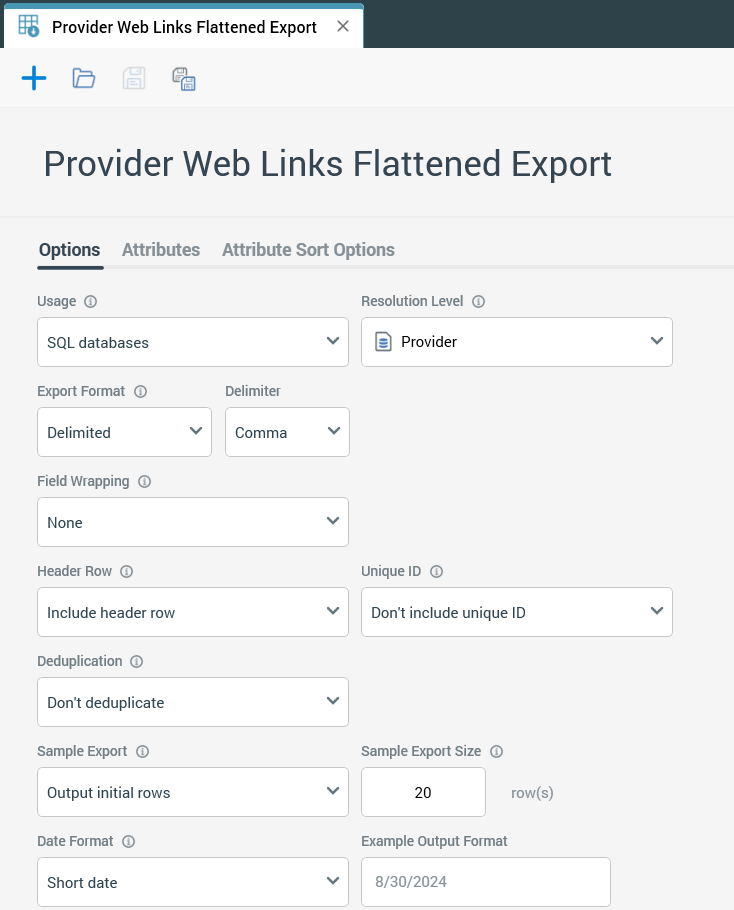
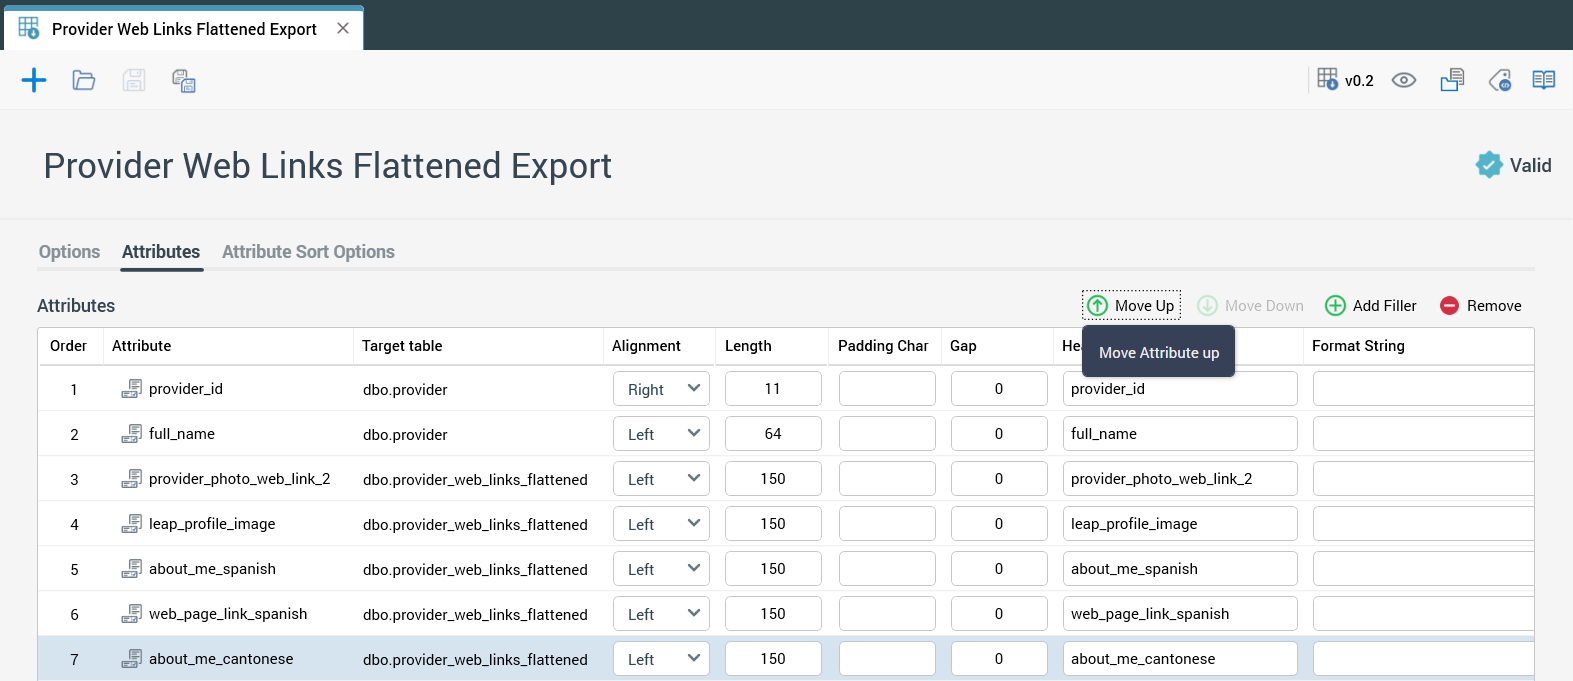
Now we can create an export template that has some fields from Provider table as well as all other fields from Provider Web Links Flattened Table.
Configure export template options
Export Template Options
Configure export template attributes
5. Validate export template
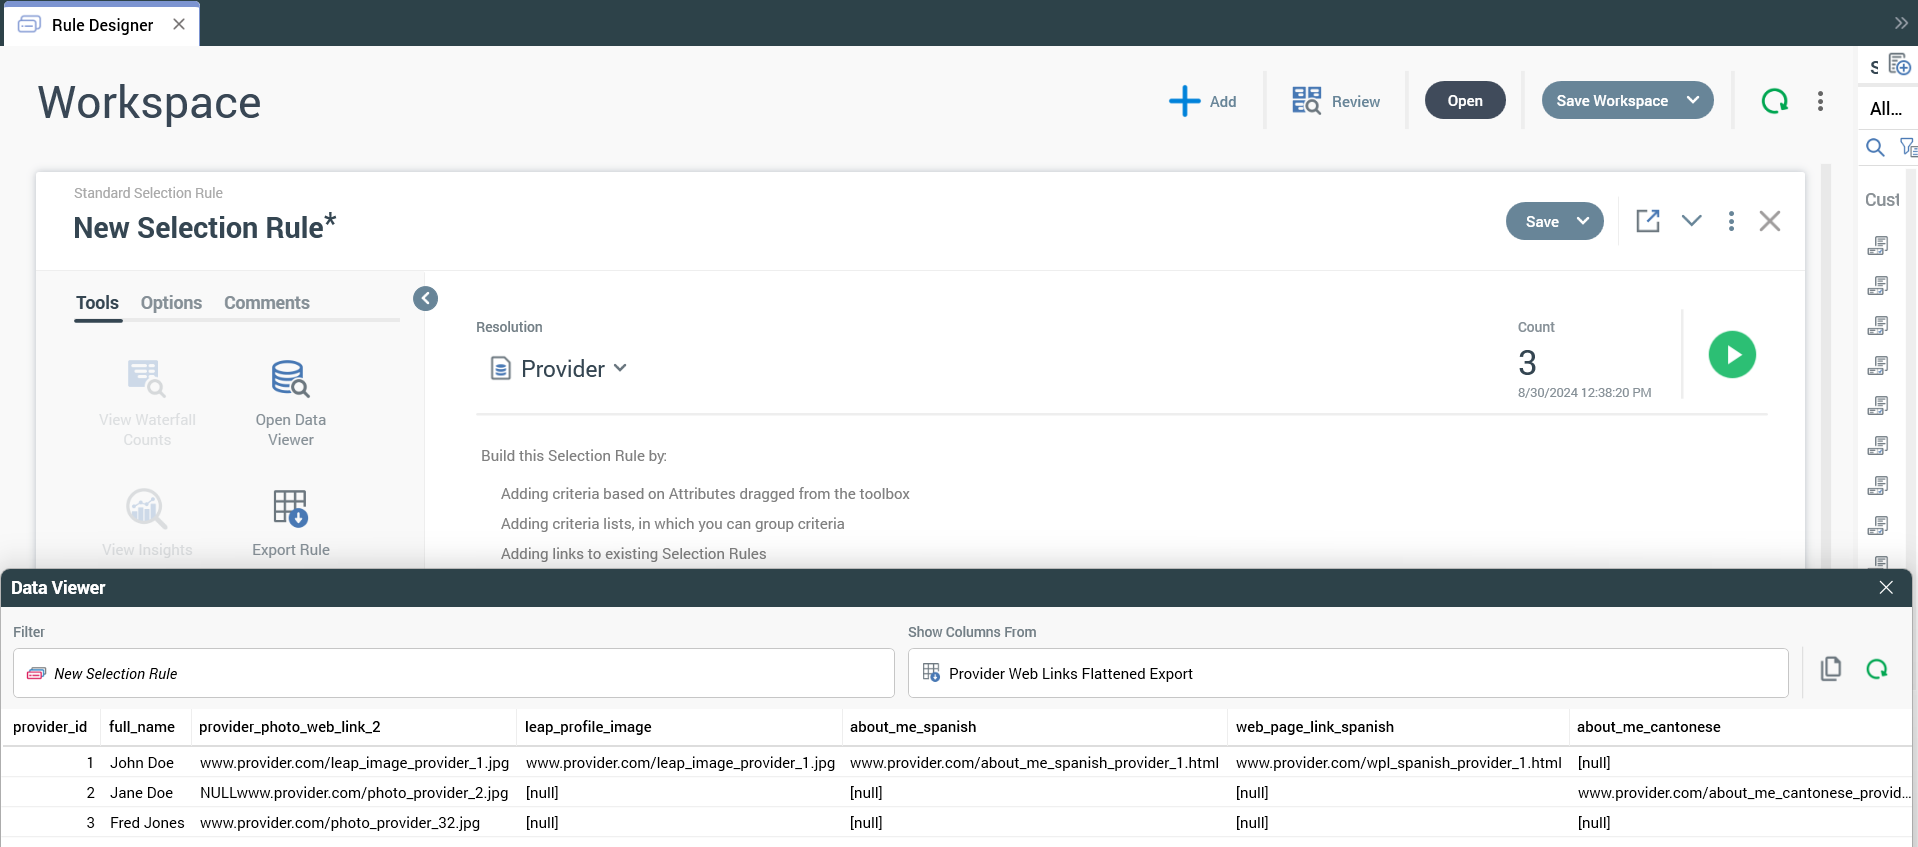
Now that we have created the export template, we can use a simple selection rule and the data viewer functionality to validate/review the data and ensure it is appearing as we would expect. Assuming it looks good, then you can use the data to export or personalize content.
Conclusion
This approach is a solid way to address 1:M relationships and the extraction/personalization with data from the many side of the diagram, but it can be a little more rigid of an approach, given that you need to potentially predefine the flattened structure or use some other database features to pivot the data, which will require database effort and thought to ensure that the approach meets your needs.
As usual, even at this point, if you get the expected results, you need to use the attributes in the exact way you intend to, either as an export or personalization content with. This testing should be done with the expected volume of records as well to fully validate the approach, and adjustments, like adding an index to the Provider Web Links to increase performance, may be necessary. If for any reason you are not getting the performance that you expect, you may need to consider other options, like multiple tables in this example as well as other options to handle 1:M.
