

Overview
The Feeds page provides detailed information about all of your feeds.
Select Feeds in the left navigation pane to view the Feeds page.
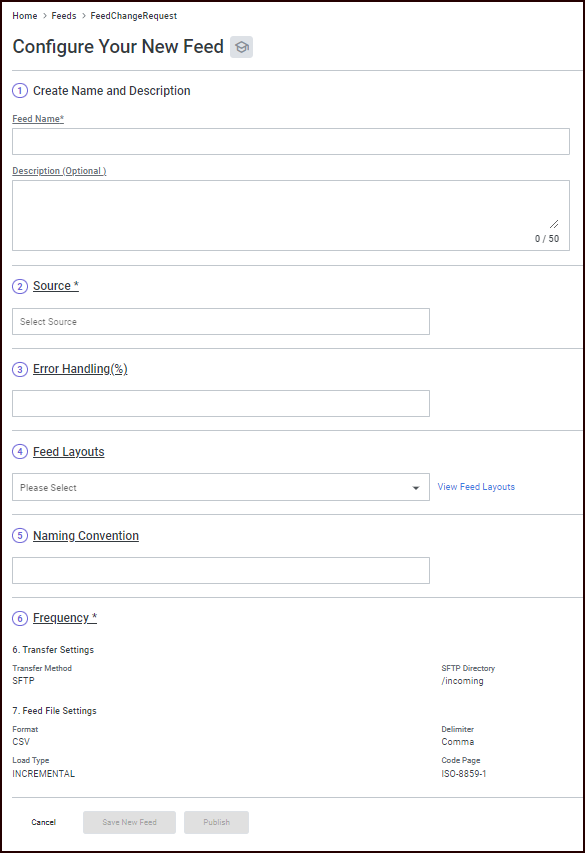
Add a new feed
To add a new feed:
-
Select Request New Feed. The Configure Your New Feed page opens.
-
Choose a Name for your feed, and optionally add a Description.
-
Choose a Source from the available sources.
-
In the Error Handling field, enter a numeric value between 0-100 that represents the percentage of allowable errors that can occur before failing.
-
Select a Feed Layout to use for the feed. You can optionally select View Feed Layouts to see the fields within a given feed layout (refer to Feed layout general information).
-
In the Naming Convention field, specify the input file pattern to use for your feed files. For example,
party_profile_*. -
The Frequency section allows you to view information about the feed you’re requesting.
-
Select Save New Feed to save the feed or Publish to run the feed.
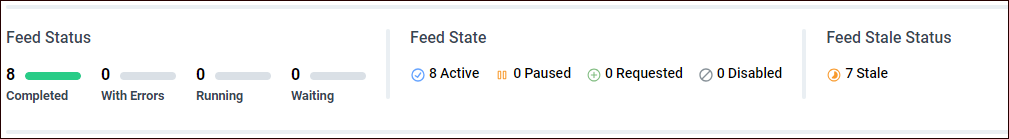
Feed status
The Feed Status section at the top of the page provides an overview of the status of your feeds.
-
The Feed Status section displays the same information as the Feed Status section on the Data observability Overview page.
-
The Feed State section displays the same information as the Feed State section on the Data observability Overview page plus the disabled feed counts.
-
The Feed Stale Status section provides information about stale feeds.
Feed list filters
Feed list filters allow you to sort and filter your feeds.
-
Toggle the Show Sources switch to display just the feeds, or the feeds categorized by their associated source.
-
Select Filters to filter your feeds by status, state, staleness, or number of records processed.
-
Select Order by to choose how feeds are ordered in the list.
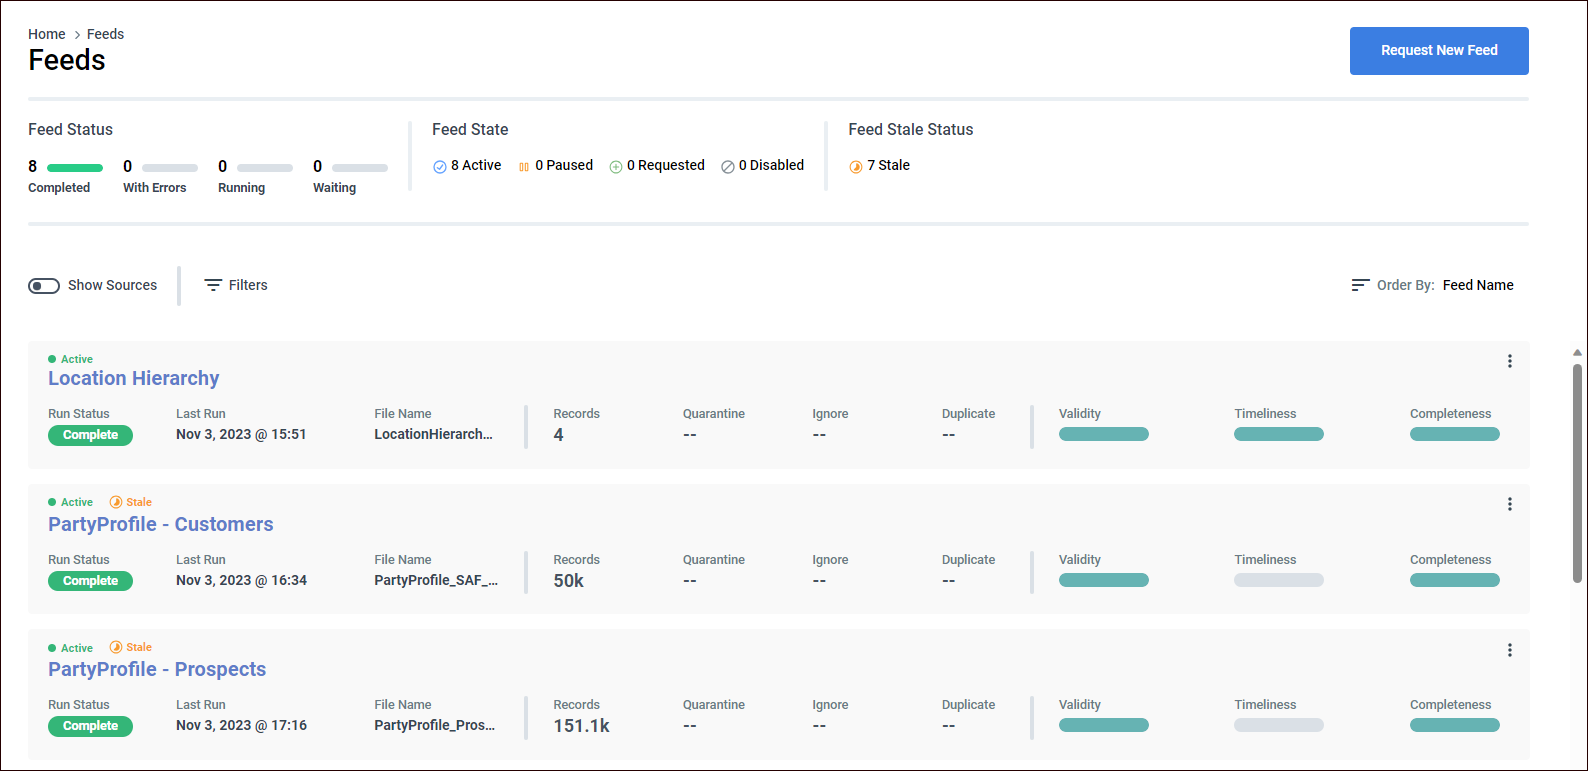
Feed list card
The feed list provides detailed information about your feeds.

-
At the top-left of each feed card in the list is the feed name. You can select the name to view the definition of that feed.
-
If there is a notable state (such as STALE or Paused), you'll see it above the feed name.
-
The Run Status shows the status of the last run (such as Running, Completed, Error, or Waiting).
-
There's also the timestamp of the last run and the source file name.
In the middle portion of the feed list card there's information about the records, including:
-
The total number of records
-
The number of records quarantined
-
The number of records ignored
-
The number of duplicate records
The right portion of the feed list card provides feed run quality metrics as well as a vertical ellipsis menu that provides options to:
-
View feed definition
-
View latest feed instance
-
Pause/start feed
-
Enable/disable feed
See Feed run quality metrics for definitions of the terms validity, timeliness, and completeness.
For a definition of quarantined in the glossary.
Feed Definition page
To display the Feed Definition page, in a Feed section on the Feeds page, do one of the following:
-
Select a feed name
-
Select the vertical ellipsis menu icon and choose View Feed Definition
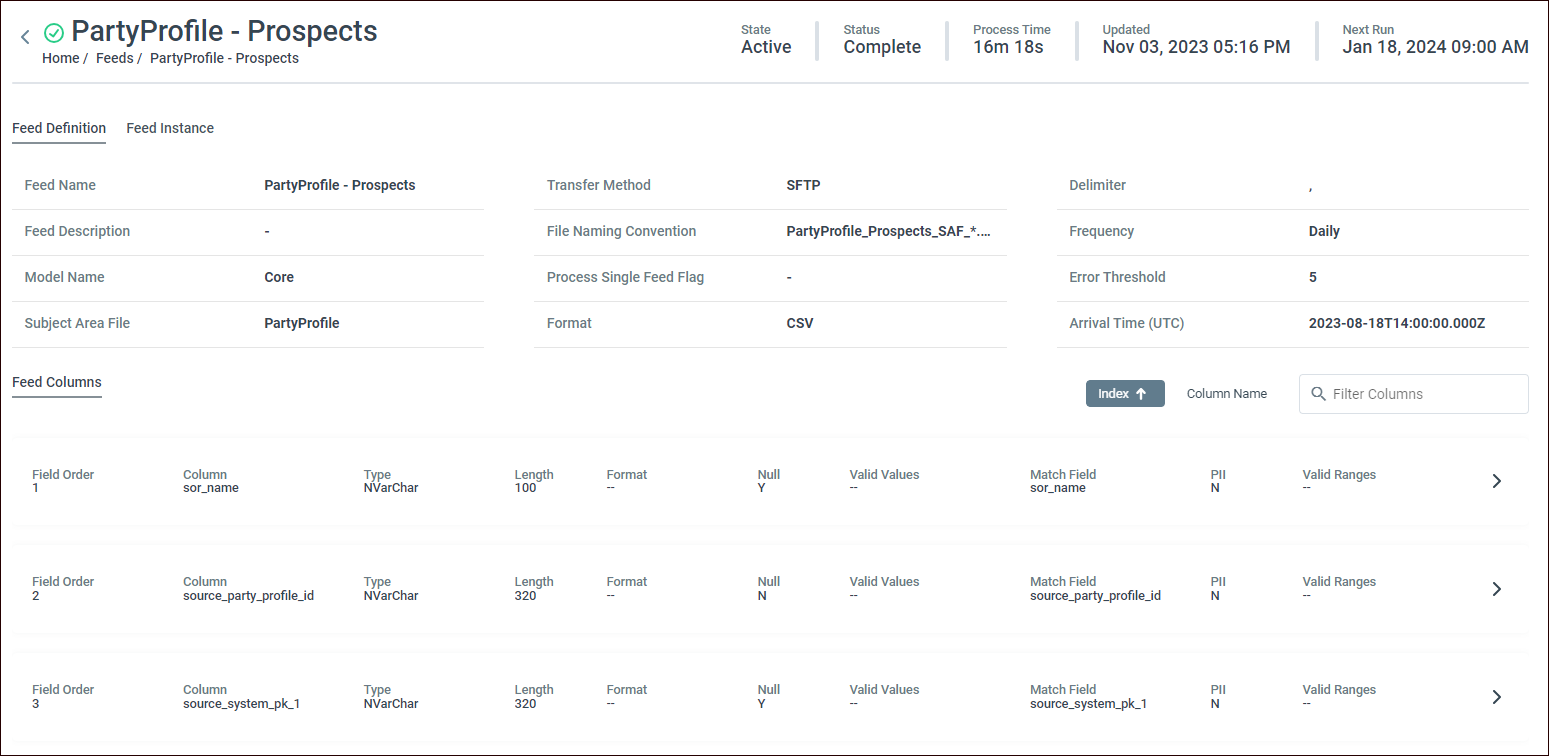
The Feed Definition page gives you a deeper understanding of what a feed does by displaying the feed metadata. It provides information about the following:
-
The feed state, status, elapsed time of the last feed run, when the last feed run completed, and when the next feed run is scheduled.
-
The feed metadata.
-
The feed columns. By default, fields are ordered by index number, in ascending order.
-
Select Index to switch to descending order.
-
Select Column Name to order by column name; select again to switch ascending to descending order.
-
Select Filter Columns to filter fields by text string.
-
For definitions of Valid Values, Match Field, PII, and Valid Ranges in the glossary.
Feed Instance page
To display the Feed Instance page, you can do either of the following:
-
In a Feed section on the Feeds page, select the vertical ellipsis menu icon and choose View Latest Feed Instance.
-
On the Feed Definition page, select the Feed Instance tab.
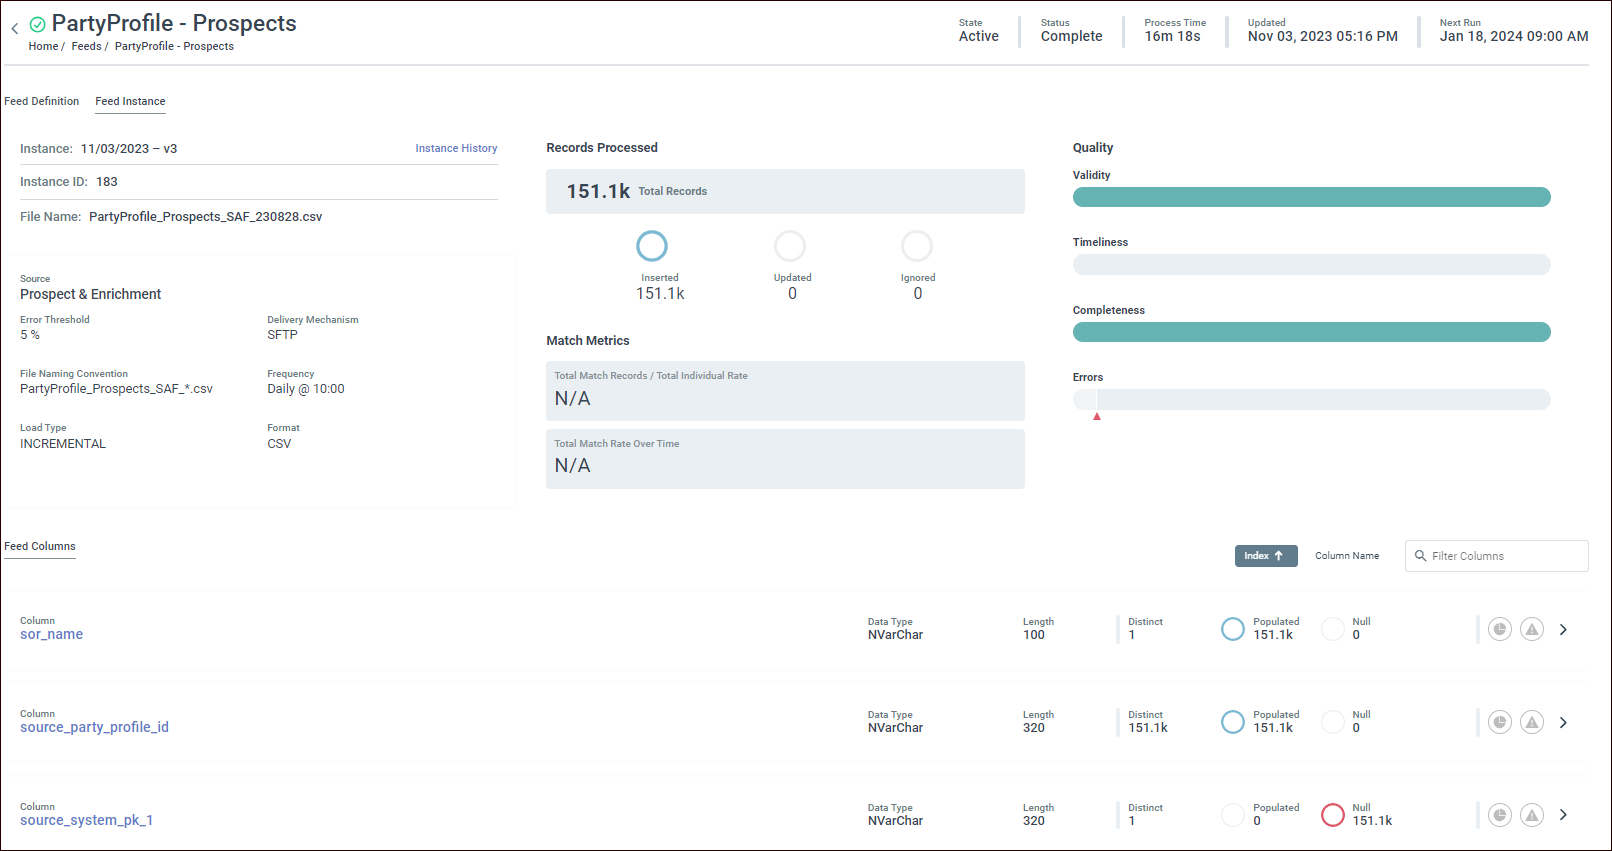
The Feed Instance page displays information on the latest run of a feed. It provides information about:
-
How many records were processed
-
How many records were inserted, updated, and ignored
-
What the total individual match rate was
-
What the quality metrics are for this run
Records Processed section
Refer to the definition of Ignore in the glossary.
Instance History popup
A history of feed runs helps you to identify patterns. Select Instance History to display a popup of a list of stats for all feed runs.
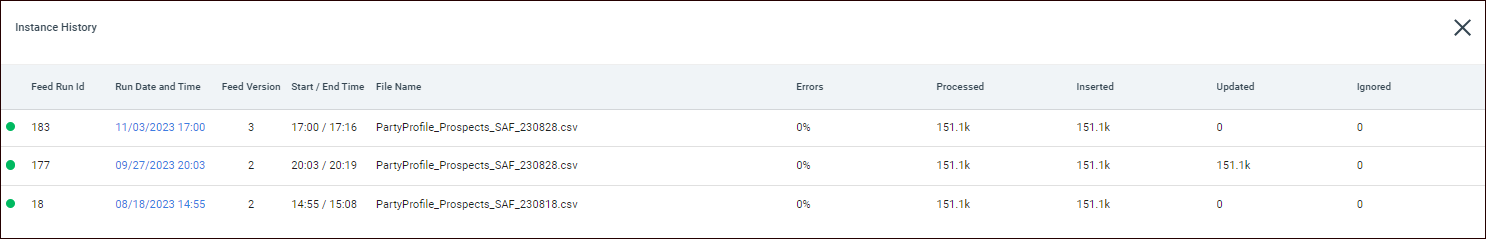
Selecting a Run Date and Time link displays the Feed Instance page for that specific feed run.
Quality section
Hover over a quality metric to display the metric value and a definition of the metric term. Gray means that there's not enough data to do a calculation.
For the Quality section, see Feed run quality metrics for definitions of terms validity, timeliness, and completeness. See staleness for a definition of the term.
Errors metric popups
Hover over the red triangle to display an Errors popup with information about the percentage of errors in a feed and the error threshold defined for the feed.
Select View to display an Errors popup that lists the actual generated errors.
Feed Columns section
This section displays the data that came in for this feed instance.
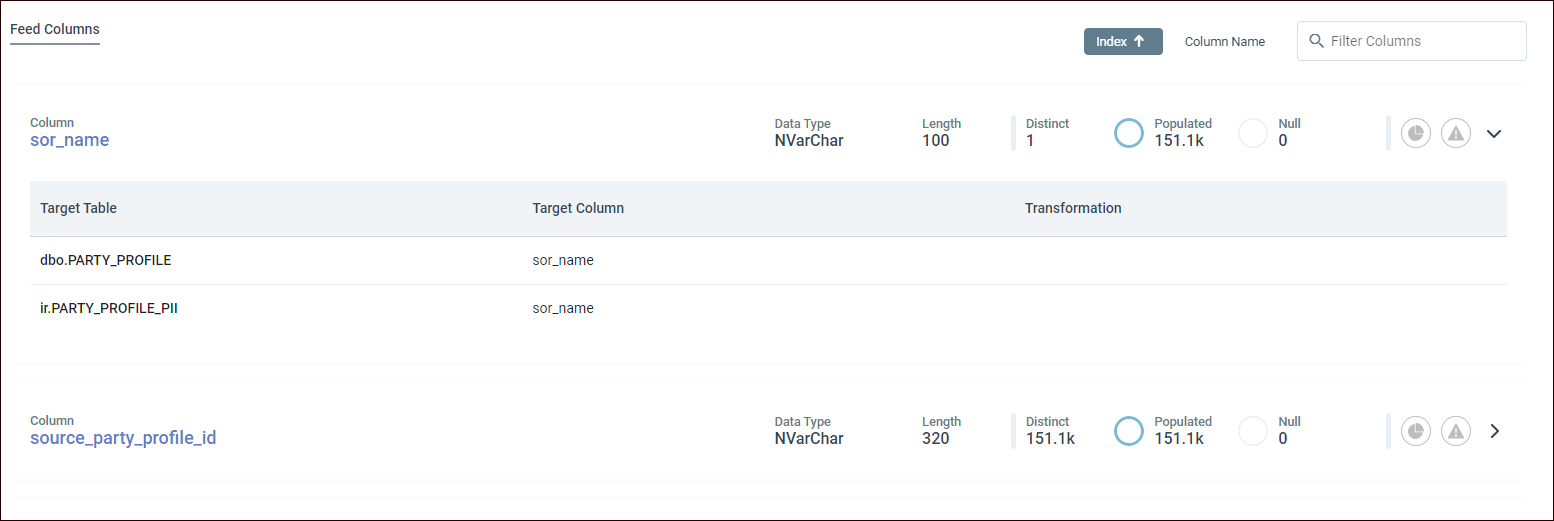
The feed columns. By default, fields are ordered by index number, in ascending order.
-
Select Index to switch to descending order.
-
Select Column Name to order by column name; select again to switch ascending to descending order.
-
Select Filter Columns to filter fields by text string.
This section also provides information about:
-
How many values were distinct
-
How many values were populated
-
How many values were null
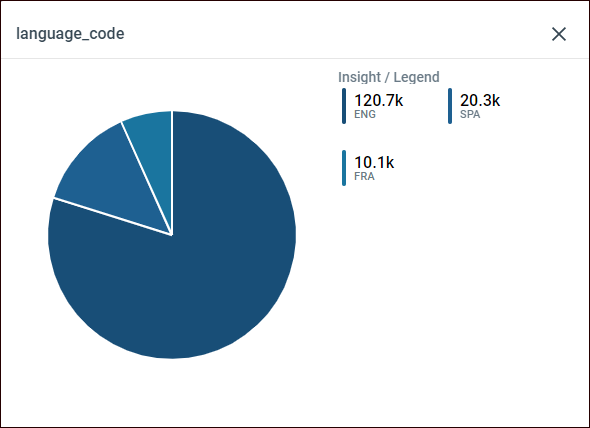
You can select the pie chart icon to display a popup of the top ten values. This can tell you whether the data being passed in is populating the correct column.
Select the right arrow to expand a section that displays which Target Table flows to which Target Column, and the transformation between, if any.