

Overview
The Quality page is used to check the quality of data in a CDP. For example, if you were about to trigger an email campaign to thousands of customers, you could make sure your data quality is acceptable by first checking this page.
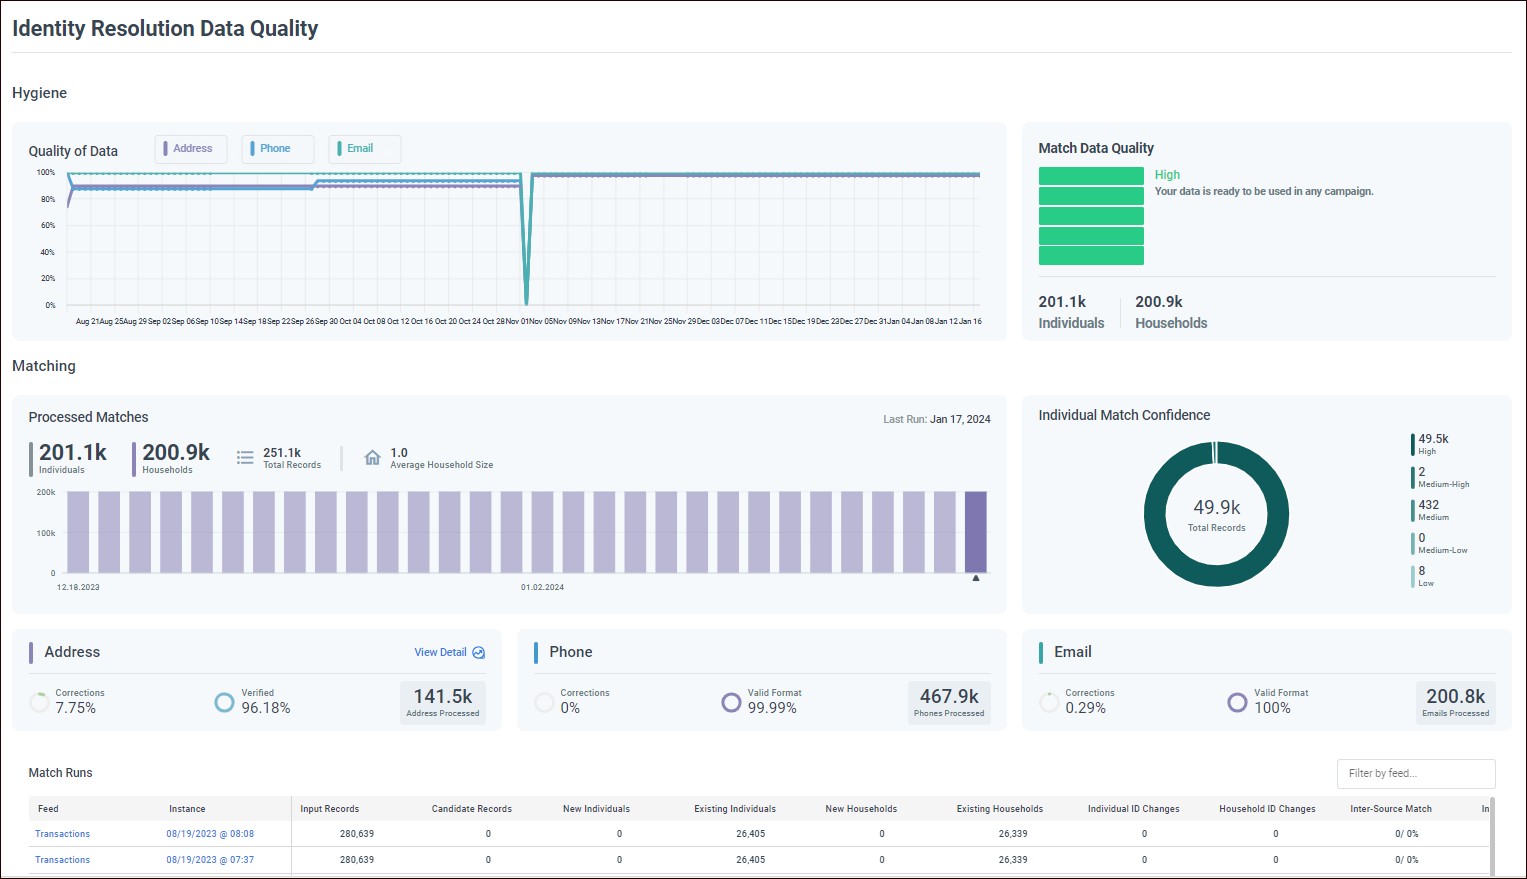
In general, you can expect to some peaks and valleys on the Quality of Data graph (depending on overall ingestion timing, ingestion loads, time of year, and so on.
Hygiene section
Quality of Data section
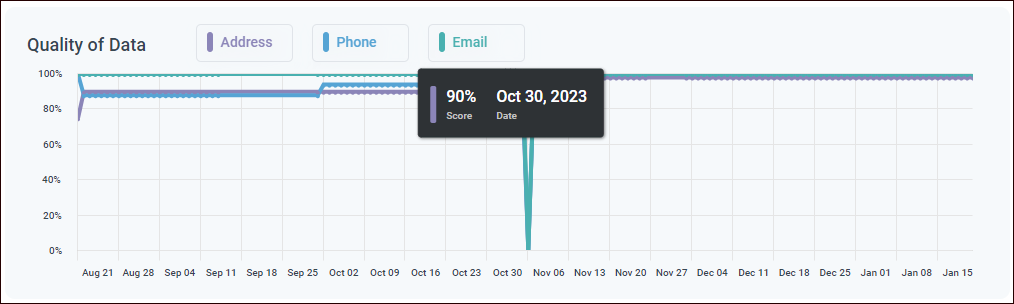
This section displays a snapshot of data quality:
-
Select a data field button to toggle between graphing and hiding field data.
-
Hover over a graphed field line to display a popup of field quality score on a specific date.
Match Data Quality section
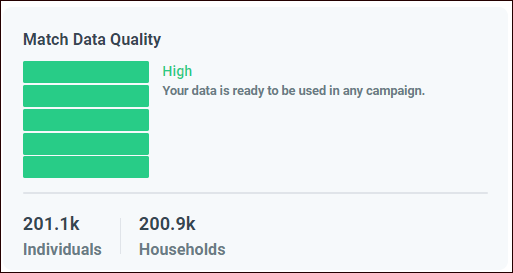
This section presents the same data as the Match Data Quality section on the Data Observability dashboard.
The information displayed in this section is another quick way of answering the question "how good is my data?"
Match data quality is an indicator of the quality of PII (Personally Identifiable Information) data used for matching. See Data quality scores for an overview of how data quality scores are calculated.
Matching section
Processed matches section
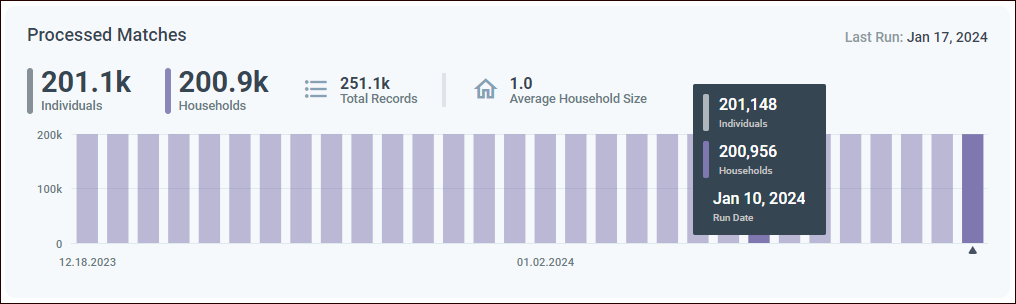
This section gives you insights into your matches, every day. It answers questions such as:
-
How many matches have been processed?
-
What is the average household size?
Hover over a colored run box to display the run stats.
Individual Match Confidence section
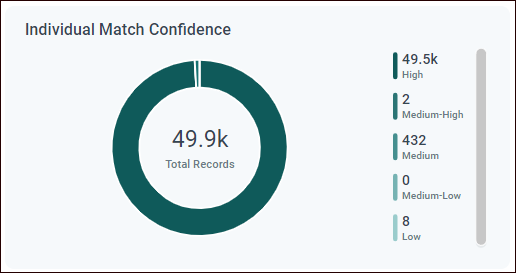
This graph gives you a more nuanced view than the Match Data Quality section. Instead of a flat rating, this graph lets you dig deeper into the numbers and see how many matches are of each quality category (high, medium-high, medium, medium-low, and low).
Match confidence relates to the threshold defined for matching. If a match score is higher than the set matching threshold (for example, 90%) it is considered a match. At this point, match quality is determined by ranges above the matching threshold and inside the matching range.
Address, Phone, Email sections
These sections delve into the individual PII (Personal Identifiable Information) component details.

-
Select View Detail to display an address hygiene report.
Correction of a PII component means updating the data as a part of the data cleansing and normalization process on ingestion.
For example, an address correction could be the addition of an address component like Delivery Point Code.
As shown in the screenshot, Redpoint CDP has processed:
-
141.5k addresses
-
7.75% of those addresses were corrected
-
96.18% of those addresses were verified
-
-
467.9k phones
-
0% of those phone numbers were corrected
-
99.99% of those phone numbers were determined to have a valid format
-
-
200.8k emails
-
0.29% of those email addresses were corrected
-
100% of those email addresses were determined to have a valid format
-
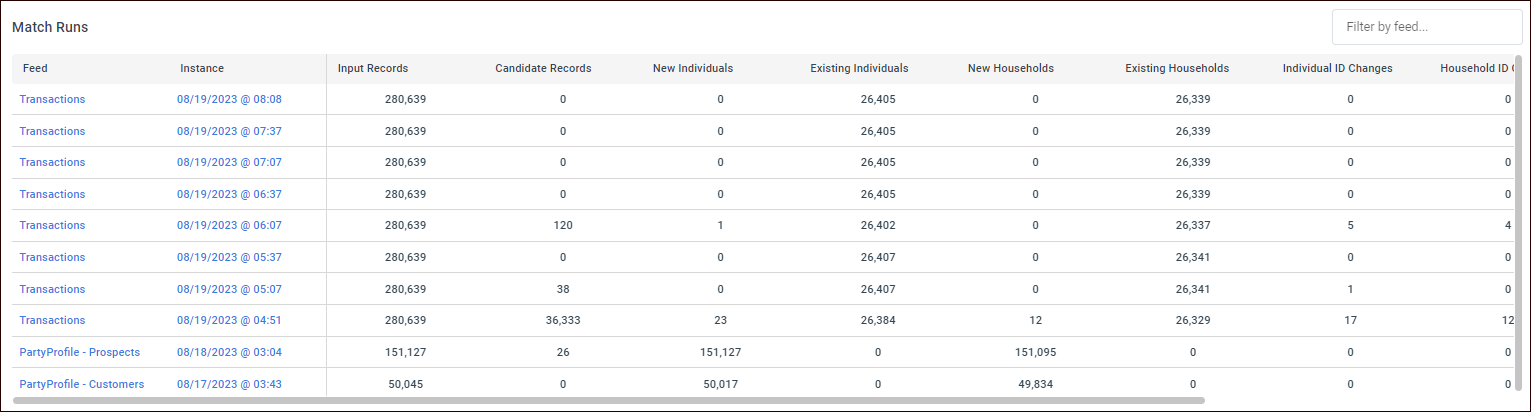
Match Runs section
The Match Runs section displays a table of feed runs in which matching is a part of the feed computational process. Each row corresponds to a single match run for the associated feed run.
-
Select the Feed link to display the Feed Definition page.
-
Select the Instance link to display the Feed Instance page.
-
Select Filter by field to filter feeds via text string.
-
The table columns correspond to feed matching fields populated by the matching run.
