Overview
The Data Readiness overview page provides high-level status information about your sources, feeds, and match data quality in real time.
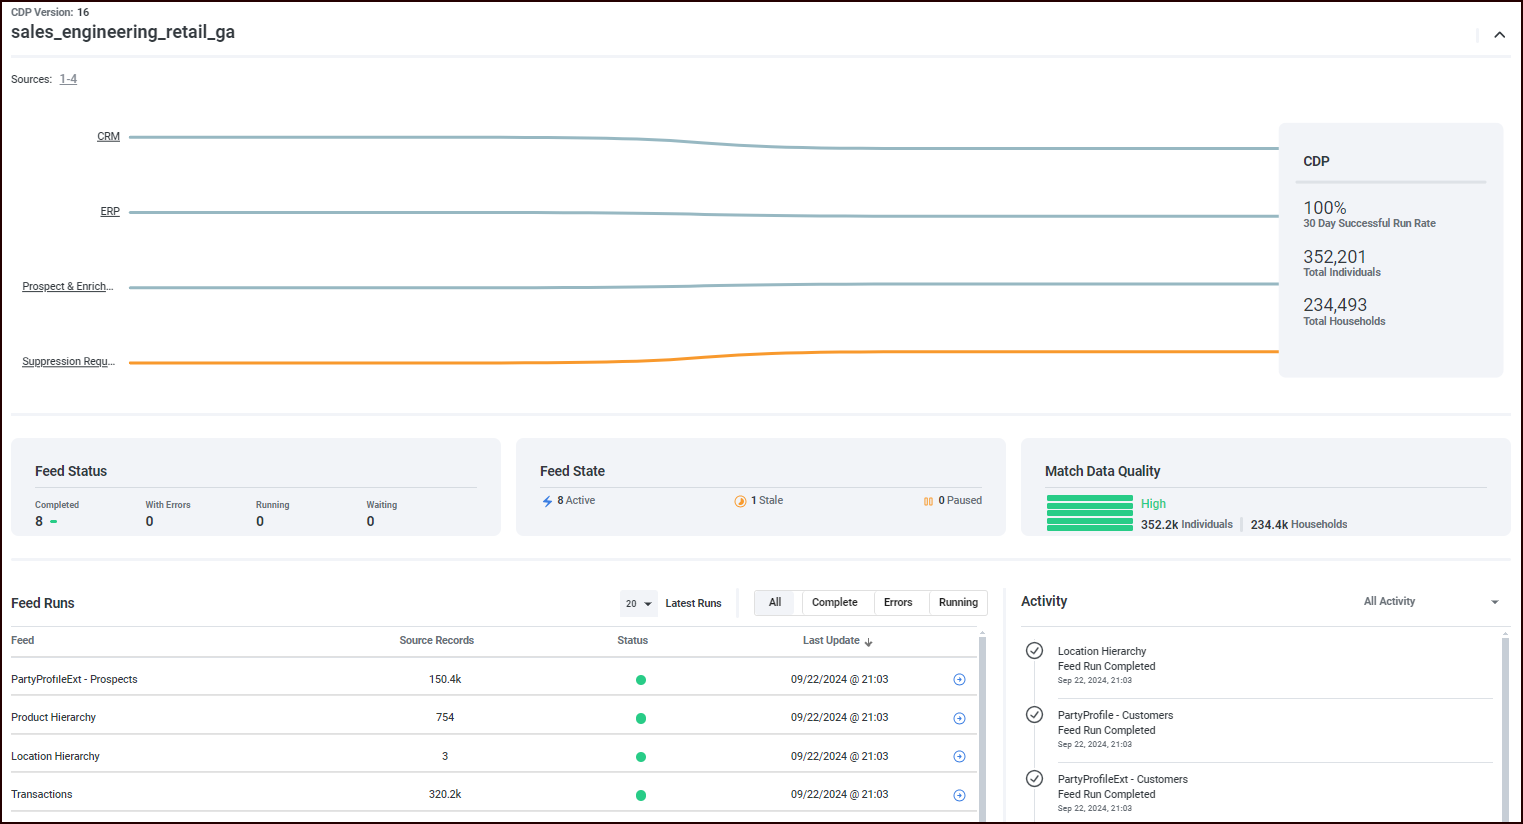
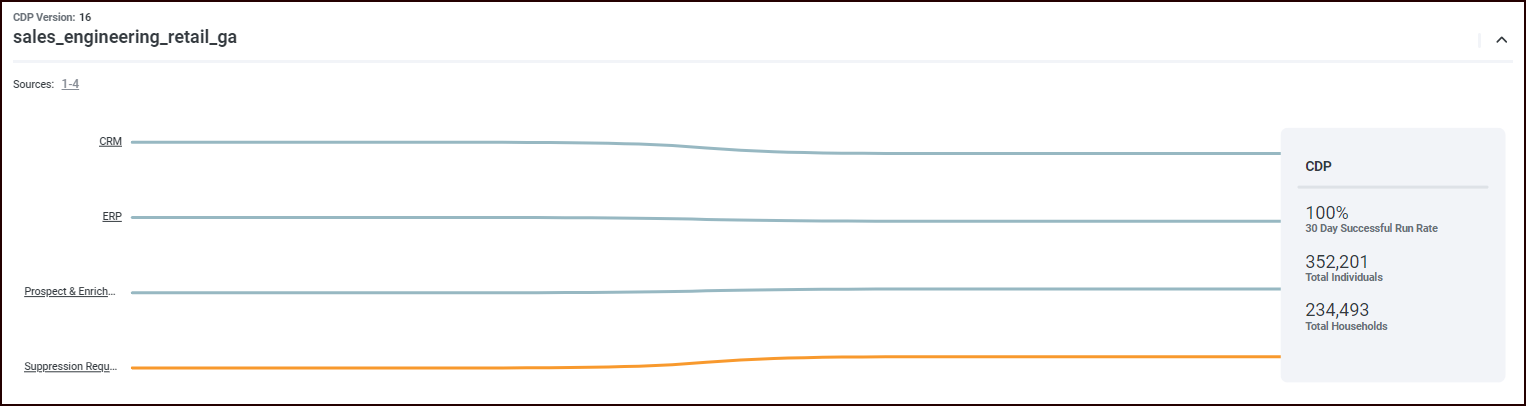
CDP Summary chart section
-
This chart displays your sources in prioritized order, as well as the status of those sources.
-
To the left, sources are ordered from top to bottom based on their assigned priority value.
-
A line leading from a source to the CDP represents all the feeds flowing from a source.
-
A gray line means that the source status is "Good".
-
A yellow line means that the source status is "Stale".
-
A red line means that the source status is "Error".
-
-
To the right, the order (from top to bottom) of feeds flowing into the CDP is based on how long ago a feed run was completed, from most-recently-completed feeds at the top to oldest completed feed runs at the bottom.
-
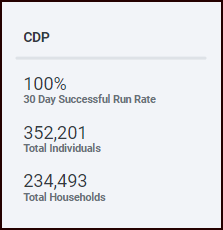
The stats in the box on the right-hand side refer to all of the feeds from all sources.
Source status
To view the status of a particular source, hover over the source feed line. The Source status pop-up appears.
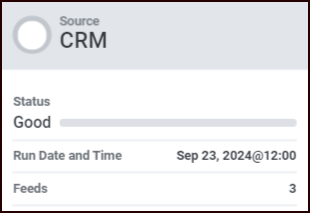
-
The source status is based on when the last feed run completed.
-
You'll also see when that last feed run completed and how many feeds are streaming from this source.
Feed Status section
See Feed status for an explanation of the term.
These values are tabulated using the last instance of each feed run (includes all feeds from all sources).
Feed State section
See Feed state for an explanation of the term.
These values are expressed as a number of feeds, and are calculated using all the feeds from all the sources.
Match Data Quality section
See Match Data Quality section for an overview of this section.
Feed Runs section
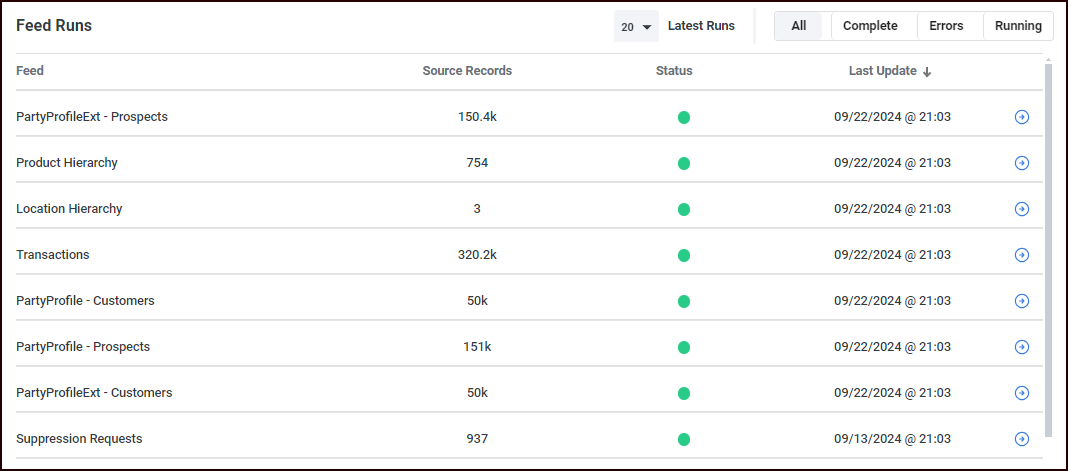
This section displays a list of feed runs, ordered by how recently the feed runs completed (by default). It breaks down the information given in the Feed Status section, and provides information about what feed runs have completed and what feed runs had errors, for example.
You can filter the feed runs that are displayed:
-
Select the column name to sort the table by that column. Select the up or down arrow next to the column name to sort in ascending or descending order.
-
Select the number of latest runs to display.
-
Choose whether to see All runs, or just those that are Complete, have Errors, or are currently Running.
You can select a feed name or a feed's right-arrow icon to display a feeds page that describes the feed in detail.
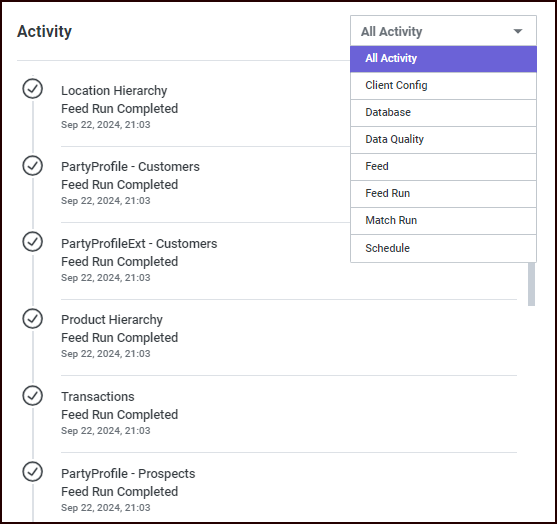
Activity section
This section displays a feed of system activity. The feed defaults to All Activity, but you can select events of a specific activity type to display.