

As you develop your tool, you'll probably need to debug it. And sometimes, even the most verbose logging messages can't help you figure out what's going on. Fortunately, your IDE's debugger can be connected to Data Management, allowing you to step through your code as the tool is executed.
Enabling remote Java debugging of projects in Data Management
To enable Java debugging, you'll need to start the Data Management Execution Server from the command line.
To start the execution server with Java debugging of projects enabled, run its executable on the command-line and add this argument.
|
where "N" is the starting debug port number you'll provide to your debugger (typically 8000).
The -debugProjectJavaPort=N option specifies a starting value; each time you open a Project, this value will increment. So if you specify -debugProjectJavaPort=8000, the first project will debug on port 8000, the second on 8001, etc. You'll need to change the debug port in your debugger accordingly. If the RPDM client is set to automatically open a blank project, that project will claim the first port number.
in addition, you may add this option to make the project server wait for the debugger attach before proceeding. This can give you a chance to debug issues only seen during startup or load. But beware, your client will be unresponsive until you attach the debugger!
|
So the complete command will look something like the following.
Windows:
|
Or like this if you wait for debugger on startup.
|
Linux:
|
Or like this if you wait for debugger on startup.
|
After running the command to start the Execution Server, start the Data Management Site Server (if it is not already running), and then launch the Data Management client.
The default new project is driving me crazy when I debug
After starting the client and connecting, if you have specified -debugJavaWait, and your client creates a new project on startup, the client will appear to hang while waiting for the debugger to connect. This is due to the fact that, by default, the client creates a new empty project for you upon startup. While this is normally convenient, it makes debugging harder because the client hangs, and it increments the debug port number.
If you do a lot of SDK tool debugging, you will quickly find it annoying to deal with the empty project that the client always opens on startup. To suppress this, go to /Settings/Users/username in the repository and check "Do not open new project on start".
Help! I can't find the right port!
Each time you create a new project or open an existing project, Data Management will increment the debugProjectJavaPort value. It will emit this value to the console under which the Execution Server is running; the message looks like this.
|
Always track this port number; it is the one you will use when attaching the Java IDE debugger. If for some reason you cannot find this message, try the following command.
On windows cmd:
|
On linux or using bash shell on Windows:
|
This will produce a list of all ports being listened to, filtering down for lines that contain "80". Hopefully you will see one line like the following.
|
In this example the port is 8004 is being listened on, and is almost certainly the port you want.
Running the debugger in Eclipse
After starting Data Management with Java debugging enabled, configure and run the debugger in Eclipse:
-
From the menu bar, select Run>Debug Configurations.
-
Select Remote Java Applications and choose New Launch Configuration.
-
Give it a descriptive Name.
-
Go to the Connect tab and browse to the project containing your Tool.
-
Set Connection Type to Standard (Socket Attach).
-
Set the Host to "localhost" and the Port to the value seen on the Execution Server control (initially the port you specified, but this number increments with each new project).
-
If you have access to the various API sources, go to the Source tab and modify the Source Lookup Path. Otherwise, accept the default.
-
Select Debug.
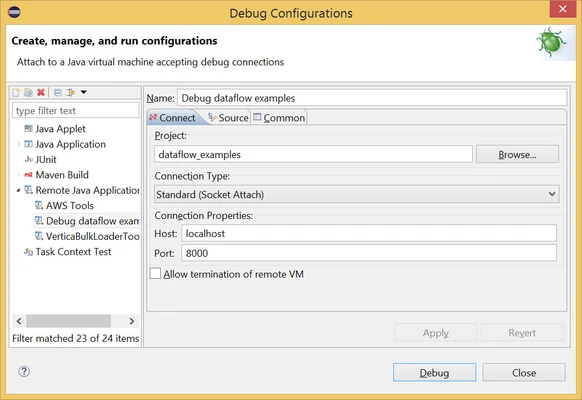
Eclipse will switch to the Debug perspective, where you can begin debugging your remote application. Java debugging is beyond the scope of this guide.
When you close a project in the Data Management client, the connected debugger will terminate.
Running the debugger in NetBeans
After starting Data Management with Java debugging enabled, configure and run the debugger in NetBeans:
-
From the menu bar, select Debug>Attach debugger.
-
Set the Host to "localhost" and the Port to the value seen on the Execution Server control (initially the port you specified, but this number increments with each new project).
-
Select OK.
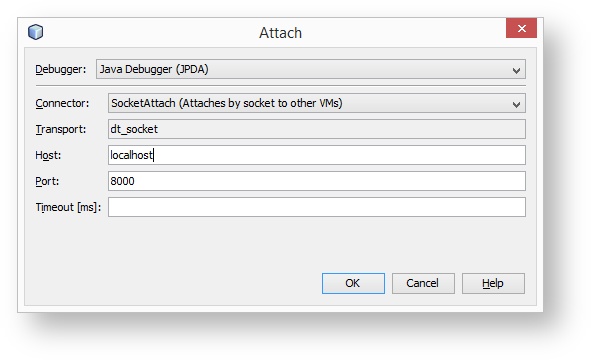
NetBeans will switch to the Debug perspective, where you can begin debugging your remote application. Java debugging is beyond the scope of this guide.
When you close a project in the Data Management client, the connected debugger will terminate.