Overview
RPI outputs trace and error information to the Log table in the Pulse_Logging database. By default, only error messages are written to the database. For diagnostic purposes, sometimes it may be necessary to increase the amount of trace logging a service writes out. This can be done using the following setting:
-
Logging__Database__RPITrace=Information
Client Logging
By default, RPI writes any client-generated logs to the following location:
-
C:\Users\[user]\AppData\Roaming\RedPoint\Client Logs
Nlog logging
In addition to the standard logging configuration, RPI containers also support NLog (NLog (nlogproject.org)). NLog can be used to configure the services to output to any of the logging targets supported by NLog. This includes logging directly to a file.
To configure NLog at any of the RPI services’ appsettings.json files, please see the following link: https://github.com/NLog/NLog.Extensions.Logging/wiki/NLog-configuration-with-appsettings.json.
Azure Monitor logging
It is possible to configure any of the RPI services to log application trace and error logging via Azure Application Insights for viewing via the Azure Monitor portal (examples given are environment variables):
-
Logging__ApplicationInsights__ConnectionString=connection-string -
Logging__ApplicationInsights__LogLevel__Default=Information
Review Application Insights overview - Azure Monitor | Microsoft Learn for more details.
NewRelic/Loggly logging
RPI supports the logging of messages to the NewRelic and Loggly providers. These can be configured using the following (examples given are environment variables):
-
Logging__NewRelic__Enabled=true -
Logging__NewRelic__ApiKey=[xxx] -
Logging__NewRelic__OptionalAttributes__0=[aaa] -
Logging__Loggly__Enabled=true -
Logging__Loggly__ApiKey=[yyy] -
Logging__Loggly__OptionalAttributes__0=[b]
The above examples include optional attributes, which can be written alongside RPI logs and used as a basis for filtering within the respective tools.
Azure Monitor Application Insights
RPI images are shipped with OpenTelemetry packages, allowing for easy integration with Azure Monitor Application Insights.
To enable this integration, the following three environment variables should be set during deployment of RPI service images:
-
APPLICATIONINSIGHTS_ENABLED=true -
APPLICATIONINSIGHTS_CONNECTION_STRING=<connection string to the Application Insights Resource in Azure> -
APPLICATIONINSIGHTS_ROLE_INSTANCE=<logical name of rpi service e.g. Realtime API, Execution Service, Node Manager service>
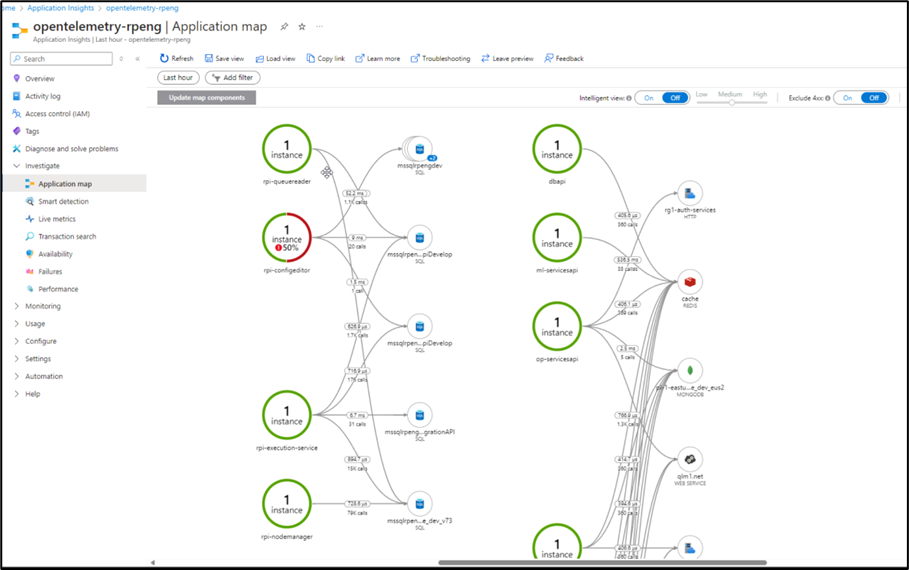
If an RPI service pod is started with these settings in place, relevant Application Performance Metrics (APM) will be sent to the Azure Monitor Application Insights service and operations teams will be able to see the full application topology of related RPI components using the Azure Monitor Application map.

More information and reference resources are listed below.

