

Overview
The Diagnostics Mode tab allows you to initiate an RPI diagnostics session. When a session is running, logs are collated for each running container. On a session’s completion, these logs, along with Audit and Telemetry reports for each tenant within the RPI cluster, are packaged into a ZIP file, which can be downloaded or copied to SFTP/Azure Blob storage.
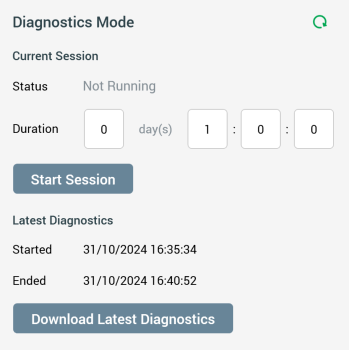
The Diagnostics Mode tab is only displayed to cluster administrator users. It contains the following:
-
Refresh button
Current Session section
-
Status: the current diagnostics mode status (one of Running or Not Running).
-
Duration: how long diagnostics mode will run for. The property defaults to 1 hour.
-
Start/End Session: this button allows you to start or end a diagnostics mode session. Start is available when a Duration is supplied. End is available when the current diagnostics mode status is Running.
Latest Diagnostics section
If diagnostics have never been collated, the message “No Diagnostics available” is displayed.
If diagnostics have been collated, the following are shown:
-
Started: this read-only property reflects the date/time at which the most recent diagnostics session's Status was set to Running.
-
Ended: this read-only property reflects the date/time at which the most recent diagnostics session's Status was set to Not Running. If Status is Running, the property is blank.
-
Button:
-
If diagnostic files are not available, the button's text reads “No Diagnostics available”, and it is unavailable.
-
If diagnostic files are available, the button's text is set to “Download Latest Diagnostics”, and it is available. When the button is selected, a Download File To... Windows file system dialog is displayed, which facilitates specification of the diagnostics package's filename, and the folder to which it is to be saved. Its default filename is “RPI Diagnostics [GUID].zip”. Selecting Save creates a Download Diagnostics job, and displays it in the My Jobs Window. When complete, an Open Folder button is displayed at the job. The diagnostics ZIP file contains:
-
For each running container:
-
Trace server log
-
Performance counter/memory dump files:
-
[Service Name]-[Service ID]-counters-[yyyy]-[mm]-[dd].json -
[Service Name]-[Service ID]-start-[yyyy]-[mm]-[dd].gcdump -
[Service Name]-[Service ID]-end-[yyyy]-[mm]-[dd].gcdump
-
-
-
For each tenant, a folder named [Tenant Name], containing:
-
Telemetry report (from Start to End)
-
Audit Log export (from Start to End)
-
-
-
Application settings control the ability to copy the diagnostics package automatically to SFTP or Azure Blob Storage (refer to the RPI Admin Guide for more details).
The System Log housekeeper removes diagnostic ZIP files from local file output after 14 days.