Overview
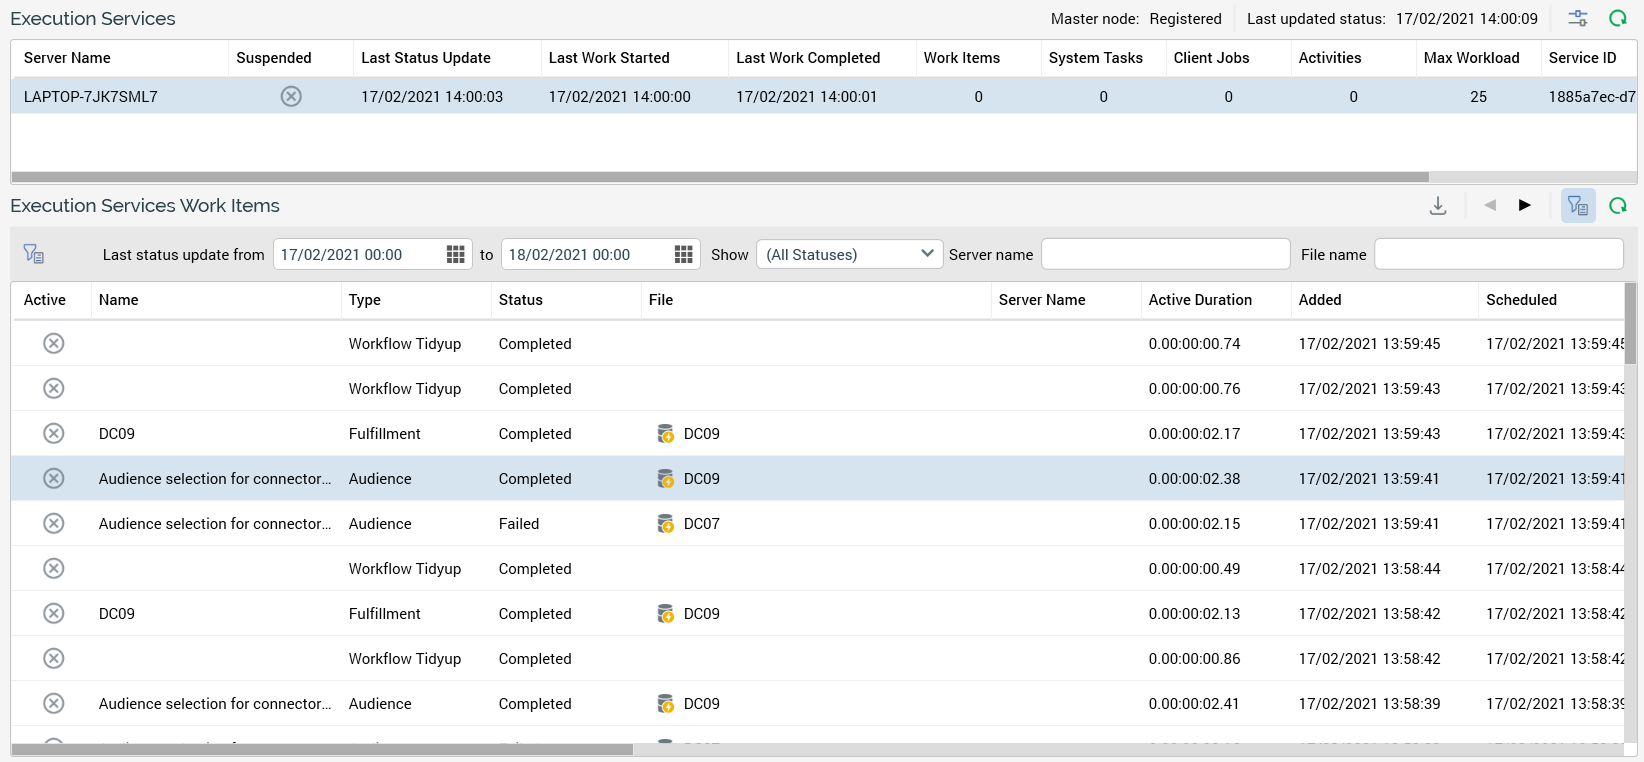
The Execution Services tab provides visibility of work undertaken at the current RPI cluster’s Execution Service(s).

The tab contains Execution Services and Execution Services Work Items grids.
Execution Services grid
The upper grid displays the list of Execution Services installed in the current RPI cluster.

A toolbar shown above the grid exposes the following:
-
Master node: this read-only property indicates if a master Node Manager is currently registered as available to assign work. It is set to one of Registered or Not registered.
-
Last updated status: the most recent date/time at which the master Node Manager updated its status.
-
Manage/View Enabled Status at Client/Cluster: selecting this button displays the available Status dialog, which allows you to control the activities undertaken by the currently-selected Execution Service at the current tenant. The button's icon has a red dot if one or more contexts of execution are currently unavailable. The dialog contains Client and Cluster lists. The Client list displays three writeable checkboxes:
-
Workflows
-
Client jobs
-
Tasks
All are checked by default. The following apply when any of the checkboxes are unchecked. -
Workflows: any new workflows initiated at the tenant will start playing, but no activity will take place therein. Within playing workflows, the next activity's execution will not commence.
-
Client jobs: any new client jobs initiated at the tenant will not execute. Any client jobs already executing are unaffected.
-
Tasks: any new system tasks initiated at the tenant will not execute. Any system tasks already executing are unaffected.
When checking a previously-unchecked checkbox, the following apply: -
Workflows: any new workflows initiated at the tenant start playing. Within playing workflows, next activity execution will commence.
-
Client jobs: any new client jobs initiated at the tenant are executed.
-
Tasks: any new system tasks initiated at the tenant are executed.
The Cluster list displays the same three checkboxes as the Client list; however, all are unavailable. The checkboxes describe each category's available status as set at the cluster level in the execution Services interface within the Server Workbench application. If a checkbox is unchecked at the cluster, it has the same effect as being unchecked at a client but is applied across all tenants in the cluster. Two buttons appear at the bottom of the dialog: -
Save: selecting this button persists any changes made within the dialog and applies the same to the selected Execution service at the current tenant.
-
Cancel: selecting this button removes the dialog from display, abandoning any changes made therein. Selecting off the dialog has the same effect.
-
-
Refresh: selecting this button reloads the list of Execution Services.
The read-only grid lists all of the current RPI cluster’s Execution Services. For each, the following properties are displayed:
-
Server Name
-
Suspended
-
An Execution service can be suspended from the Execution Services interface in Server Workbench.
-
-
Last Status Update
-
Last Work Started
-
Last Work Completed
-
Work Items
-
System Tasks
-
Client Jobs
-
Activities
-
Max Workload
-
Service ID
Execution Services Work Items grid
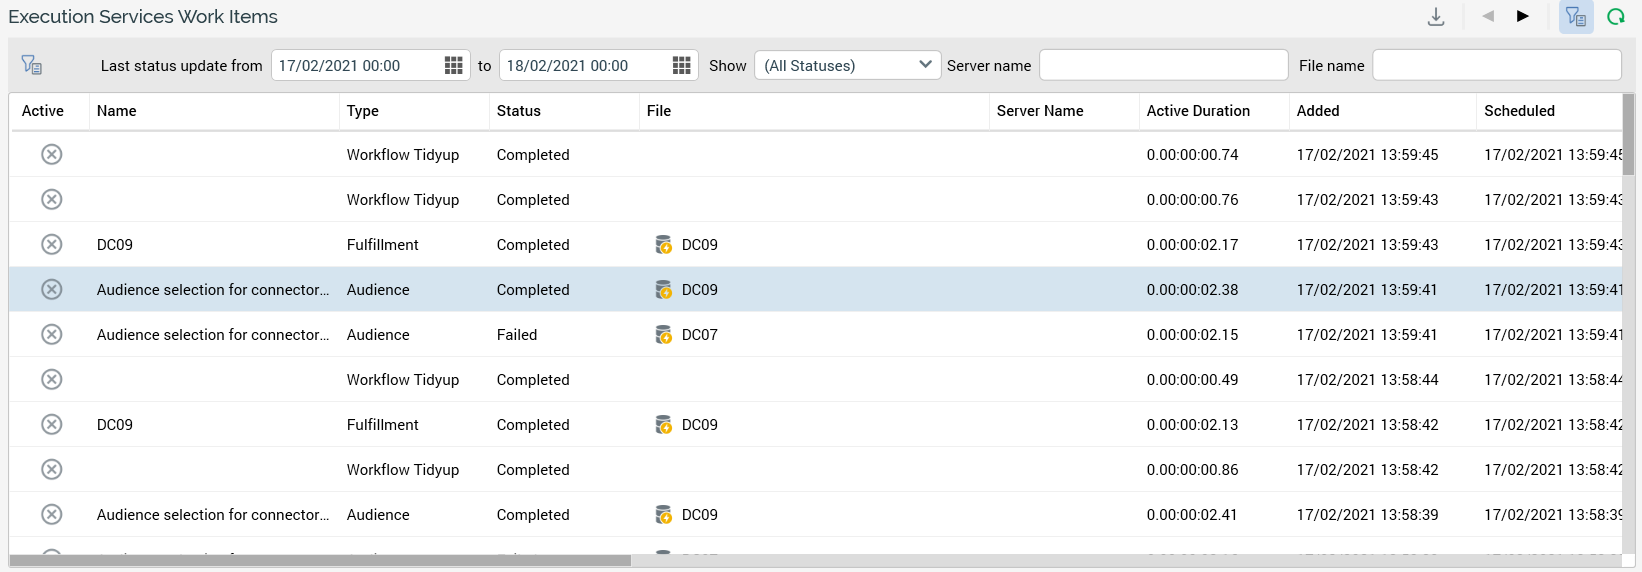
The lower grid lists work items associated with the listed Execution Service(s).

A toolbar displayed above the grid exposes the following options:
-
Export Search Results: this button is available when results are displayed in the grid. Invocation displays the Save Execution Service Search Results Windows file system dialog. The default filename provided is “Execution Service Search Results [yyyy-mm-dd].txt”. You can select Save to initiate the file save (the file is saved directly, without creation of a job). The file itself contains a tab-delimited dump of the data displayed in the grid. A header row is provided.
-
Previous page: this button is available when the list of work items will not fit into a single page, and a page other than the first is displayed. Invocation displays the previous page's worth of data.
-
Next page: this button is available when the list of work items will not fit into a single page, and a page other than the last is displayed. Invocation displays the next page's worth of data.
-
Show/Hide Execution Service Search Options: this toggle button controls display of the search options toolbar. It is selected by default.
-
Search: selecting this button refreshes the grid with only work items that match the supplied criteria.
The search options toolbar exposes the following filter options:
-
Last status update from: this date/time defaults to today, 12:00AM.
-
[Last status update to]: this date/time defaults to tomorrow, 12:00AM.
-
Show: this dropdown allows you to filter the list of work items by status. It exposes the following values:
-
All Statuses (the default)
-
New
-
Initializing
-
Running
-
Suspended
-
Completed
-
Failed
-
Terminated
-
Invalid
-
Queued
-
-
Show/Hide Execution Service Search Options: a toggle button, which, when selected, displays the Execution Service Search Options dialog. The dialog allows you to filter the list of work items by:
-
Server name
-
File name
-
The read-only grid lists work items instances matching the current search criteria. The number of records shown per page is controlled by system configuration setting MaxTableSearchRows. Records are presented in descending Added order.
The following columns are displayed:
-
Active
-
A tick or cross icon
-
-
Name
-
Type
-
Status
-
File
-
Only if relevant; if populated, accompanied by Open Latest Version and Open File Location buttons
-
-
Server Name
-
Only shown when activity is currently taking place
-
-
Active Duration
-
Days
-
Hours
-
Minutes
-
Seconds
-
-
Added
-
Date/time
-
-
Scheduled
-
Date/time
-
-
Last Status Update
-
Date/time
-
-
Last Status Message
-
Execution ID
-
GUID
-
-
Workflow Association Instance ID
-
Only if relevant
-
-
Activity ID
-
GUID if relevant
-
-
Workflow Added
-
Date/time
-
-
Workflow Active
-
A tick or cross icon
-
-
Workflow Execution Status
-
Execution Service ID
-
GUID; only shown when activity taking place
-
-
File ID
-
GUID; only shown when relevant
-
You can sort data in the grid by selecting on a column header.

