

Overview
Dashboards are stored as files in the RPI file system, the same way as any other file type. Dashboards are created and edited in the Dashboard Designer interface. Dashboards are viewed in the Dashboard Viewer.
Dashboard Designer
The Dashboard Designer is displayed in its own tab in the RPI framework.
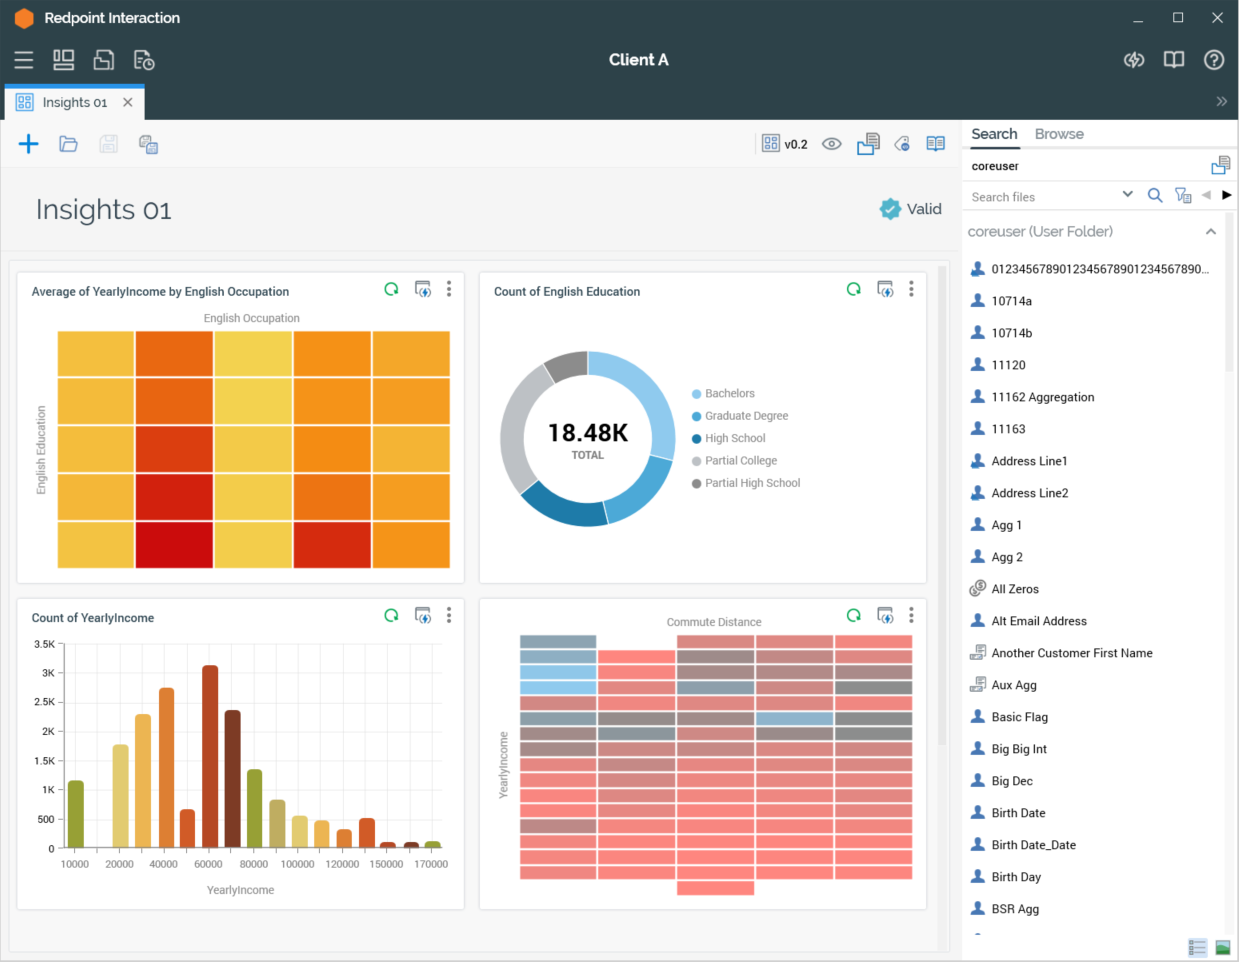
It is used to create and manage dashboards and the widgets that they contain.
The Dashboard Designer contains the following elements:
-
Toolbar
-
Properties
-
Toolbox
-
Widgets
Invoking the Dashboard Designer
You can invoke the Dashboard Designer in the following ways:
From the quick access menu’s Dashboards menu. The menu exposes the following options:
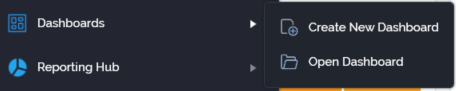
-
From a Tasks or File Type widget: typically, these might be displayed at your Home Page.
-
By double-clicking a dashboard file in the File System Dialog: or by highlighting a dashboard and selecting OK in the same context.
Access to the Dashboard Designer is controlled via the Dashboard – Design functional permission. If none of the user groups of which you are a member are associated with this permission, you will not be able to able to access the Dashboard Designer.
Start page
The Dashboard Designer Start page is shown upon invocation of Dashboards at the quick access menu, and also on selecting Create new Dashboard at the Dashboard Designer toolbar.
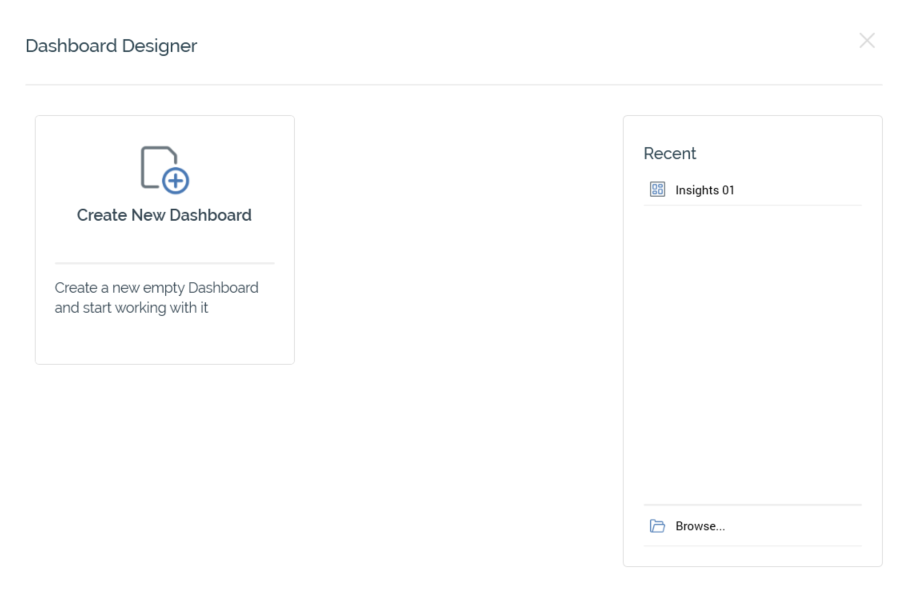
It contains the following:
-
Create New Dashboard button: selecting the button displays a new, unconfigured Dashboard in the Dashboard Designer.
-
Recent: lists recently-accessed dashboards, facilitating the opening of the same.
-
Browse: displays the Open Dashboard File System Dialog, allowing you to select a dashboard to open.
A Cancel button is shown at the top of the Start Page. Selecting it removes the Start Page from display, and redisplays the Dashboard Designer. The Cancel button is only shown on invocation of the Start Page by selecting Create new Dashboard at the Dashboard Designer toolbar.
Toolbar
The Dashboard Designer toolbar exposes the following options:
-
Create new Dashboard: selecting this button displays the Dashboard Designer Start Page. A close button is shown to its top right; selecting it removes the overlay from display. If a dashboard containing unsaved changes is displayed at invocation of Create New, an “Are You Sure?” dialog is shown, from which you can:
-
Save the changes
-
Abandon the changes
-
Abandon creation of the new Dashboard
-
-
Open an existing Dashboard: invocation of this option displays the Open Dashboard File System Dialog. You can navigate accessible folders in the RPI file system to locate the dashboard that you wish to open. Only dashboard files are shown. Having located a dashboard, you can select OK or double-click it to display it in the Dashboard Designer. You can also select Cancel to close the File System Dialog without opening a dashboard.
If a dashboard or containing unsaved changes are displayed, you can:-
Save the changes
-
Abandon the changes
-
Abandon opening the dashboard
-
-
Save the current Dashboard: this option is unavailable when no outstanding changes are present within the dashboard. If the dashboard has not been saved, Save behaves like Save As.... If dashboard has previously been saved, invocation of this option saves any dashboard changes to the existing dashboard file.
-
Save the current Dashboard as...: invocation of this option displays the Save Dashboard As… File System Dialog, allowing stipulation of the filename to which to save the new dashboard file.
Configuring a dashboard’s name
A dashboard’s name is configured in the large property shown at the top of the Dashboard Designer, below the toolbar. Provision of a name is mandatory, and the value provided may be a maximum of 100 characters. The dashboard’s name is the same as the filename under which it is saved within the RPI file system. As such, it must be unique amongst the dashboards in the folder within which saved.
You can edit a dashboard’s name by selecting the property. Complete the edit by selecting off the property, or by hitting return.
Dashboard validation
Before a dashboard or widget can be used, it must be valid.
A validation status indicator is displayed to the right of the dashboard’s name, and at certain widgets’ footers. When the dashboard or widget is valid and contains no validation errors, the validation status indicator is shown as a blue checkmark icon.
Specific validation errors are outlined in the this documentation. When one or more validation errors is present, a validation error indicator is shown as a red “x” icon.
Selecting the indicator lists the validation errors in a dialog:
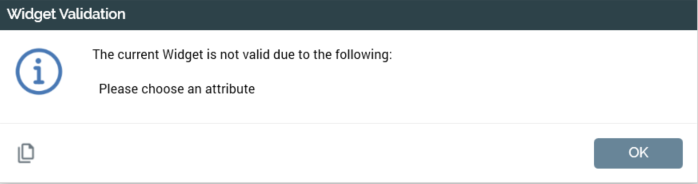
You can use the button at the bottom left of the dialog to copy the validation error details to the clipboard. You can close the dialog using the OK button.
Toolbox
The Dashboard Designer toolbox contains a the standard RPI Folder Search component.
The toolbox is constrained to display only attribute, interaction, offer, and selection rule files.
Header
If you add a header to a dashboard, it is inserted below the current line of widgets.

Its default text is “Header”, and it is presented initially in edit mode (you can change the text, and then select off the header, or hit Return, to leave edit mode).
A mini toolbar is displayed on hovering over a header:

It exposes the following options:
-
Edit Header Text: invocation presents the header in edit mode (note that double-clicking the header has the same effect). A header's maximum length is 100 characters. Note that, if required, you can create a header with no text.
-
Remove Header: invocation removes the header. This option is protected by an “Are You Sure?” dialog.
As with widgets, you can use drag and drop to re-position headers within a dashboard.
Dashboard viewer
When you open a dashboard directly, for example from the File System Dialog or Recent Items, it is displayed in the Dashboard Viewer.
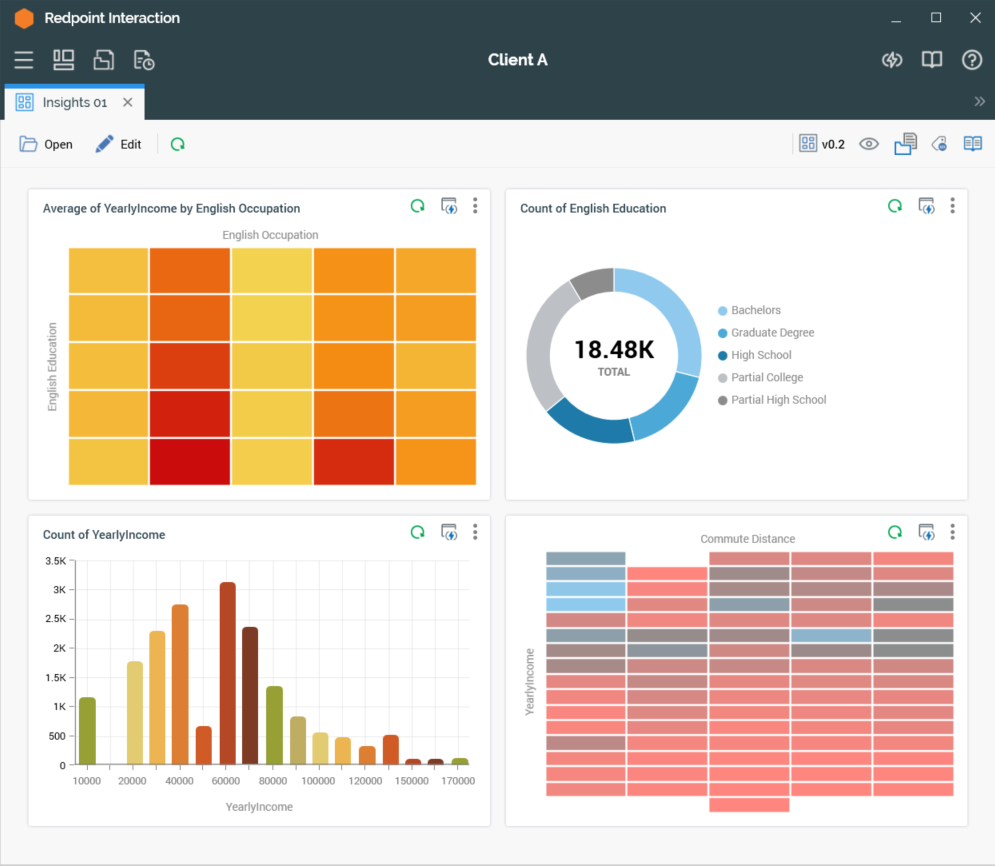
The Dashboard Viewer contains a toolbar and the widgets with which the dashboard is configured.
The toolbar exposes the following options:
-
Open: selecting this button displays the Open Existing Dashboard File System Dialog, which allows you to select a dashboard file to display in the Dashboard Viewer.
-
Edit: selecting this button replaces the display of the dashboard within the Dashboard Viewer with its being shown in the Dashboard Designer.
-
Refresh All: refreshes all of the widgets displayed currently in the dashboard.
The dashboard’s widgets themselves are displayed as per their current configuration.
When shown in the Dashboard Viewer, a dashboard’s structure cannot be changed.
Sharing widget content as a Pulse:
The Share as Pulse button is shown at the Chart, Count Results and Channel Overview widgets. Selecting it displays the Share Content as Pulse dialog, which allows you to share details of the widget, including a visual representation of its currently-displayed state, a message and file attachments, as a Pulse.
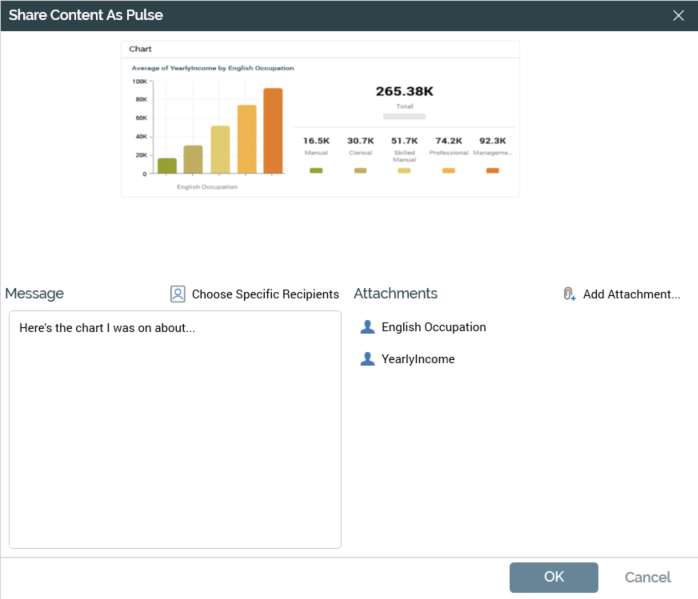
The dialog contains the following:
-
Widget image: displayed at the top of the dialog. A screen capture of the widget at the point of sharing is displayed.
-
Message: displayed to the bottom left of the dialog. It allows you to specify a Pulse message to accompany the image. Provision of a message is mandatory, and the maximum supported message length is 300 characters.
-
Choose Specific Recipients: this button is displayed above the Message field and allows you to select recipients for the Pulse from a context menu. Having selected one or more recipients, the number thereof is displayed as a mini icon at the Choose... button. The sending of Pulse message to specific recipients is described in the Pulses widget documentation.
-
Attachments: this section is displayed to the bottom right of the dialog. It allows you to attach files to the Pulse, which will be accessible when displayed as a Pulse. It is accompanied by an Add Attachment button, invocation of which displays the Add File Attachments to Pulse File System Dialog, in which you can select one or more files to attach to the Pulse.
Attachments are listed in the section. An inline Remove Attachment button is displayed on hovering over an attachment, invocation of which removes the attachment without displaying an “Are You Sure?” dialog. An information tooltip is shown on hovering over an attachment.
Files can be attached automatically when the Share Content as Pulse dialog is displayed. The files attached depend on the widget at which Share was invoked:
-
Chart:
-
Attribute
-
Heatmap attribute
-
Function attribute
-
Filter
-
-
Count Results:
-
Rules to Chart
-
Two buttons are shown at the bottom of the dialog:
-
OK: selecting this button posts the Pulse. Having done so, a confirmatory message is displayed.
-
Cancel: selecting this button removes the dialog from display.
If the dashboard from which a widget is shared also contains a Pulses widget, the latter is automatically refreshed after content has been shared.
Closing the Dashboard Designer
You can close the Dashboard Designer by closing the tab within which it is displayed, or by shutting down RPI itself. If you do so when the Designer contains a dashboard with unsaved changes, a dialog is shown, within which you can choose to do the following:
-
Save the changes and proceed with closing the Dashboard Designer.
-
Abandon the changes and proceed with closing the Dashboard Designer.
-
Cancel closing the Dashboard Designer or RPI.