

Overview
You can invoke the Realtime Report in the following ways:
-
From the Reporting Hub’s Native Reports section: selecting the option displays the Realtime Report in a new tab in the RPI interface. You can open more than one Realtime Report at the same time, if required.
-
From the Realtime Report option: within a widget or exposed within the quick access menu’s Reporting Hub task.
Access to the Realtime Report is controlled via the Realtime Report functional permission. If none of the user groups of which you are a member are associated with this permission, you will not be able to access the Realtime Report.
Realtime Report basics
The Realtime Report is displayed in a separate tab in the RPI framework.
It contains the following:
-
Header
-
Tracked Items
-
Overview
-
Detailed Results
-
By Item
-
By Metric
-
Header
The Realtime Report header exposes the following:
-
Show: selecting Show displays a dialog in which you can choose the type of items to be shown in the Realtime Report using the following checkboxes, which are all checked by default:
-
External Web Pages
-
Interactions
-
Landing Pages
-
If a single item type is selected, its name is displayed at the property. If more than one is selected, "[n] Types" is displayed at the property. If no types are selected, "No Types" is shown. Changing the selection refreshes the tracked items list, and charts, automatically.
Interactions are displayed within the Realtime Report if they match the supplied filter criteria, and the date range selected intersects with the duration post-execution for which their fulfillment states continue to be monitored for updates.
-
From: defaults to today - 1 month. Date from must be less than Date to.
-
To: defaults to today. Date to must be more than Date from.
-
Search by name: you can enter a search string to limit the items displayed in the Realtime Report to those with a name matching the entered value. The search is applied as soon as you stop typing in the field. A dropdown list of recent searches is available.
-
Refresh: reloads the Realtime Report with the latest set of insight data across the supplied date range. Any newly-created items that match the specified filter criteria are added to the Tracked Items list. If all previously-displayed items were checked, any newly-displayed items are also checked. If not all previously-displayed items were checked, any newly-displayed items are not checked.
Following a refresh of the Realtime Report, zero results are only displayed at charts if results are returned by execution of the query. If no results are returned, zero results are not shown.
-
Filter States: you can limit the items displayed within the Realtime Report to only those with state results that match one or more selected states.By default, only "Default states" are shown. These are defined as Page Visit, Link Select, Form Submission (for web pages), and Targeted (for interactions). If only default states are currently selected, this setting reads "Default States". This is the initial setting upon invocation of the Realtime Report.
If a single state has been selected, the text "[Context] - [State]" is displayed.
If multiple states have been selected, [n] States is displayed.
Selecting the property displays the Choose States and Metrics dialog.
You can expand each group therein to reveal the states that they contain. Each state is accompanied by a checkbox. You can check those that you wish to view in the Realtime Report.
The dialog lists the following:-
Web events states: these include the following:
-
Form Submission
-
Link Click
-
Page Visit
-
Note that the duration that is required to have passed before a page visit by a given visitor using a given browser is deemed to be recorded as a new page visit is controlled by Interaction web.config setting
ThresholdBetweenPageVisitsMinutes.
-
-
Any custom web event states defined at the web events adapter
-
-
Channel states: these are grouped by channel.
-
Goals: you can choose to filter by goals defined as goal smart assets’ and landing pages’ optimization goals, and the latter’s additional goals.
-
State Flow states: the state flow states.
-
Having elected to apply a state filter, you can select the Clear the currently selected States button to revert to display of the default states.
-
Group States: this option can be switched between Yes (the default) and No values. If set to Yes, states with the same name are grouped together at the Realtime Report charts; e.g. all "Targeted" state counts are grouped together, even if collated at disparate channels, and all identically-named goals are counted together, even if the goals in question are defined at separate landing pages.
If Group States is set to No, separate channels’ common states are shown separately (e.g. "Data Extract - Targeted" and "Eloqua Email - Targeted").
-
More Filters: selecting More Filters allows you to filter the Realtime Report by web publish site (applicable to landing pages only) and RPI file system folder (applies to landing pages and interactions). Selecting More Filters displays a dialog.
-
Site: you can limit the items displayed in the Realtime Report to just those landing pages that have been published to a specific web publish site, or folder therein. Selecting Choose publish location displays the Choose Publish Location dialog. You can select a web publish site or folder and then select OK. When you do so, the Realtime Report is filtered to show only landing pages published to the selected location. Having selected a site or folder, you can clear it.
-
Folder: you can select Choose folder to select a folder using the Choose Folder dialog. When a folder has been selected, only landing pages and interactions saved to the selected folder are displayed in the Realtime Report.
-
Having selected a folder, a Search subfolders checkbox is displayed below Folder. If checked, all subfolders within the selected folder searched for files to display in the Realtime Report.
Also having selected a folder, you can clear it. When you do so, the selected folder and Search subfolders checkbox are removed, and the filter restriction is lifted.
Tracked Items
This section, displayed to the top left of the Realtime Report, lists all landing pages, external web pages, and/or interactions that match the currently-specified filter criteria.
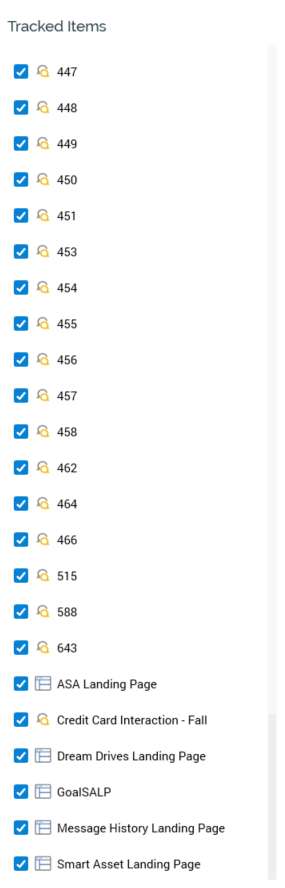
Items accordant with current search settings are listed. Currently-selected items are reflected at the Overview line chart and Detailed Results section. If no items are displayed, a message is shown.
For each item, the following are displayed:
-
Checkbox: checked by default. When checked, data relating to the item are shown in the Realtime Report charts. When unchecked, data relating to the item are not shown.
-
Icon: indicating whether the item is a landing page, external web page, or interaction.
-
Name
-
Toggle whether the results of this item are charted separately: this toggle button is not selected by default. When it is selected, series relating to the item in question are displayed at the Overview chart and legend.
Multiple items can be charted separately. A separately-charted item no longer counts towards standard aggregated results series (Page Visit, etc.).
-
Toggle whether the latest daily published versions of this item are shown: this toggle button is only shown at landing pages and is not selected by default. When selected, is displays the time positions at which versions of the landing page were published on the Overview line chart. The first published instance of any given version shown (it is possible for a version of a landing page to be published multiple times; at each act of publishing the page, an instance is created). A version is represented by vertical dashed line. A black label at the bottom of the dashed line displays the version number.
Double-clicking a landing page in the list displays the page's most recent version in the Published Item Details interface. You can open multiple landing pages in separate Published Instance Details concurrently.
Double-clicking other item types has no effect.
A context menu is shown when you right-click an item:
-
Show All Items: this option checks all items and displays their metrics in the charts.
-
Hide All items: this option unchecks all items and removes them from the charts.
-
Hide All But This: this option unchecks all items apart from the current.
-
View Realtime Details: this option is only available at landing pages. It displays the current landing page's details in the Realtime Details interface.
-
View File Information...: this option is only available at landing pages and interactions. It displays the current file's details in the File Information Dialog.
-
Open Latest Version: this option is only available at landing pages and interactions. It displays the file's details in the Landing Page Designer.
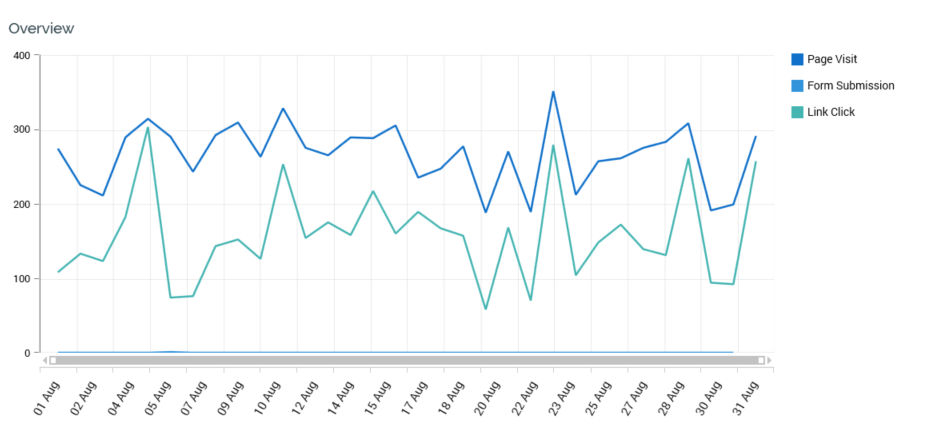
Overview
This section contains a line chart, which displays time series values relating to metrics gathered in respect of published landing pages across the currently-specified date range.
When no data are available to be shown, a message is displayed.
You can change the date range displayed within the chart by shortening or lengthening the horizontal scroll bar displayed at the bottom of the line chart manually, or by using the mouse wheel.
By default, the following series are shown:
-
Page Visit
-
Link Click
-
Form Submission
-
Targeted
Any custom web events metrics and states are also displayed if they exist, along with series representing any separately-charted items' metrics.
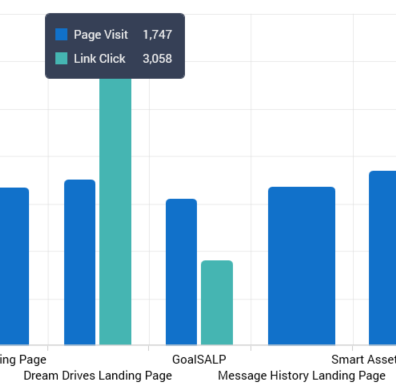
On hovering over the chart, a vertical line, with points marking metric series' values, is displayed at the date nearest to the cursor.
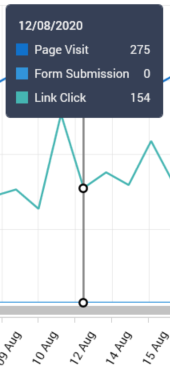
A legend at the top shows the currently-displayed series' counts for the date in question.
A legend is displayed to the right of the chart.
It displays each aggregated metric:
-
Page Visit
-
Link Click
-
Form Submission
-
Targeted
Custom web events states and metrics (if metric values exist) are also shown. In addition, any Separately-charted landing pages’ series are also displayed.
A tooltip is shown when hovering over a legend entry.
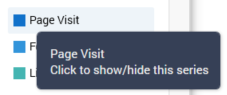
Selecting the same shows or hides the series. A series is grayed out at the legend and removed from the chart when hidden, and the vertical scale is adjusted accordingly. A series is also removed automatically at the By Item stacked bar chart in the Detailed Results (if displayed).
Detailed Results
This section contains a detailed results stacked bar chart, which displays aggregated series' values across the visible date range displayed in the Overview line chart.
When no data are displayed, a message is shown.
The section contains a tab set with two tabs:
-
By Item: this tab is shown by default. It displays one stacked bar per landing page in the visible date range shown in the Overview line chart.
-
By Metric: this tab displays one stacked bar per aggregated metric across the visible date range shown in the Overview line chart.
By Item
The By Item stacked bar chart displays one stacked bar per landing or external page, or interaction, in the visible date range in the Overview line chart.
Bars are ordered alphabetically by name. A numerical count is displayed each section within a bar. Only checked landing pages are shown.
On hovering over a bar, a tooltip is displayed.
This displays each aggregated metric's count:
-
Page Visit
-
Link Click
-
Form Submission
-
Custom web events states and metrics (if shown)
-
Interaction states
By Metric
The By Metric stacked bar chart displays one stacked bar per aggregated metric, with data sourced from across the visible date range in the Overview line chart.
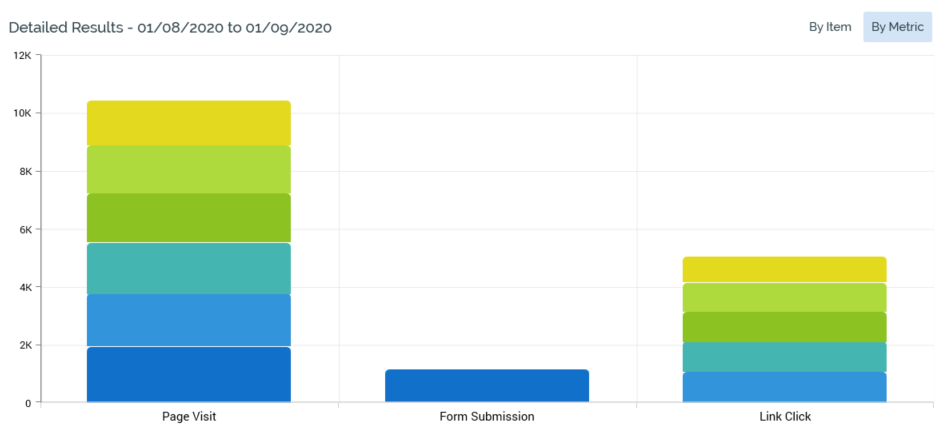
The following metrics are shown:
-
Page Visit
-
Link Click
-
Form Submission
-
Custom web events states and metrics (if available)
-
Interaction states
A numerical count is displayed at each section within a bar (if space permits). Only checked landing pages are shown.
On hovering over a bar, a tooltip is displayed. Its contents depend on the metric in question:
-
Page visit: displays the count by landing page. Entries are presented in descending value order. If more than ten values are available, the top ten values are displayed, and the sum of the remaining values shown as "All others".
-
Link Click: displays URLs clicked.
-
Form Submission: displays the names of submitted forms.
-
Web event state or metric: displays state or metric counts only.
Collating Realtime Report Results
Results are made available in the Realtime Report when a published landing page is associated with a web events adapter. Page Visits, Link Clicks, and web events results are collated at execution of the Web events importer system task. Form Submission results are collated at execution of the Web form processor task.
If a landing page is not associated with a web events adapter, Page Visits, Link Clicks, and web events results are not collated.
External Web Pages in the Realtime Report
To be viewed in the Realtime Report, an external page must be configured to use the Realtime JavaScript web client with the client option enablePageVisitTracking set to true.
Documentation around the configuration and use of the JavaScript Realtime web client to enable client-side integration between a web site and the Redpoint Realtime API can be found in Deployment Files in the following directory:
DeploymentFiles\InteractionRealtimeAPI\RPIFormValidation\shared\js\rpiwebclient\documentation\index.html
The following metrics are captured by default at an external page:
-
Page visit
-
Link click
At least one web events adapter must exist for external page metrics to be captured. Metrics are captured on execution of the Web events importer system task.
You can use the rpiWebClient.sendMetric function at an external page to record a web events metric. The metric must be defined at the default web events adapter. Please refer to the Realtime JavaScript web client documentation referenced above for full usage details of the sendMetric function.
Interactions in the Realtime Report
The Realtime Report affords visibility of interactions' production channel results, as captured at workflow execution. Results are sourced from offer, decision offer, export and control activities
Interaction results are displayed at the Overview line chart and Detailed Results bar charts. A result value is shown at the date when received by RPI. Any associated custom state flow-provided metrics are also available listed (these are collated at execution of the Fulfillment state flow count updates system task).
An interaction qualifies for display within a date range if the range supplied intersects with the time period for which RPI continues to monitor its workflows for receipt of results data.
Closing the Realtime Report
You can close the Realtime Report at any time by closing the tab within which it is displayed, or by shutting down RPI itself.