

Overview
The Query Trace Log tab provides visibility of the SQL generated and run during selection rule, audience and interaction fulfillment activity execution.
It consists of a toolbar, Query Trace Log grid, and Selected Query Trace Log details.
Toolbar
The toolbar exposes the following:
-
Export Query Trace Log: invocation of this option displays the Save Query Trace Log Windows file system dialog. The default file type is set to Text Files, file name to 'Query Trace Log [yyyy]-[mm]-[dd]' and folder to the folder in which the client application is currently running. You can select Save to save the Query Trace log to a file or Cancel to close the dialog without saving. The file thus generated contains details of all of the displayed Query Trace logs (even if displayed across multiple pages. For each log entry, the following information is shown:
-
Execution type
-
Context
-
Query status
-
Query result
-
Started
-
Ended
-
Duration
-
File [name] ([GUID])
-
Activity [name] ([GUID]) (‘N/A’ if selection rule)
-
Workflow Instance ID
-
Query String
-
Error Message
Two hyphens are added at the beginning of any non-SQL lines of text within an exported Query Trace log. The same applies at any error messages. This makes it easier to execute the resultant SQL immediately in a SQL execution environment (e.g. SQL Server Management Studio).
-
-
Previous page: this option is available if multiple pages’ worth of Query Trace logs are shown, and a page other than the first is displayed. Invocation returns to the previous page of results.
-
Next page: this option is available if multiple pages’ worth of Query Trace logs are shown, and a page other than the last is displayed. Invocation moves to the next page of results.
-
Show/Hide Query Trace Log Search Options: this toggle button controls display of the search options toolbar. It is selected by default.
-
Refresh: invocation of this option initiates search for all SQL logs matching the supplied search criteria. Search results are displayed in the Query Trace Log grid. A message is displayed when no matching records exist.
The search options toolbar exposes the following filter options:
-
Date from: the first date and time from which point Query Trace logs are to be displayed. Date from defaults to 00:00 today.
-
Date to: the latest date and time to which point Query Trace logs are to be displayed. Date to defaults to tomorrow, 00:00..
-
Show: a dropdown, which allows you to choose whether to view All Statuses (the default), just Completed or Failed SQL statements’ logs, or long running queries logs.
-
Activity ID
-
Workflow instance ID
Any specified filter options are applied at Search invocation.
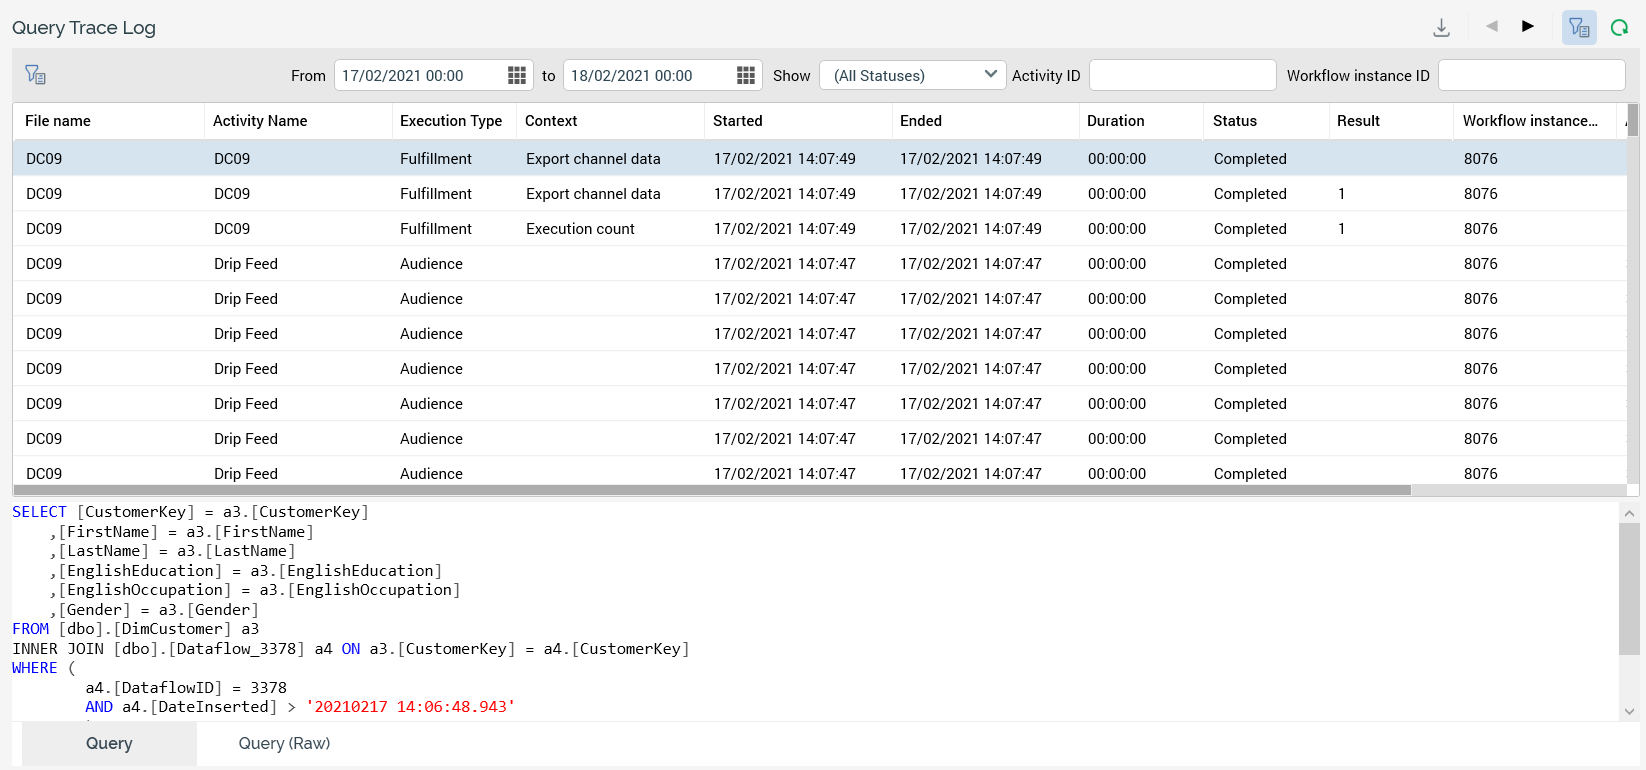
Query Trace Log grid
The grid is populated automatically on displaying the tab for the first time, in accordance with the default search criteria.
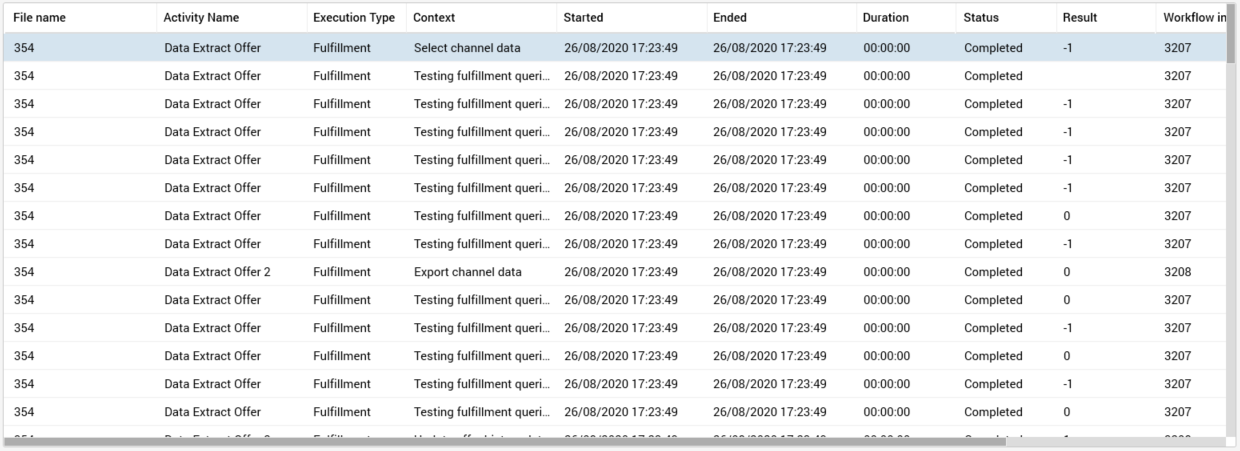
Following execution of a search, any matching log entries are listed in the Query Trace Log grid. If no matching entries exist, a message is displayed. Log entries are ordered by Started date. For each log entry, the following properties are displayed:
-
File Name
-
Activity Name: blank if selection rule
-
Execution Type: one of Audience , Fulfillment, Selection rule or Analysis Panel
-
Context: describing the scenario in which the SQL execution occurred
-
Started: date/time
-
Ended: date/time
-
Duration: HH:MM:SS
-
Status
-
Result: if a select query, the number of records returned. If a non-query transaction (e.g. an insert or update), 0 (False) or -1 (True).
-
Workflow Instance ID
-
Activity ID: GUID
-
File ID: GUID
Note that the time for which RPI will wait before adding a Query Trace log for a long-running query is controlled by system configuration setting LongQueryTraceLimit.
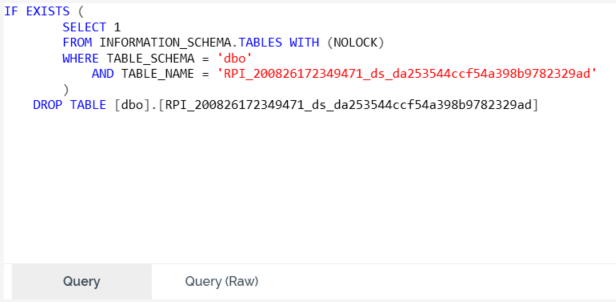
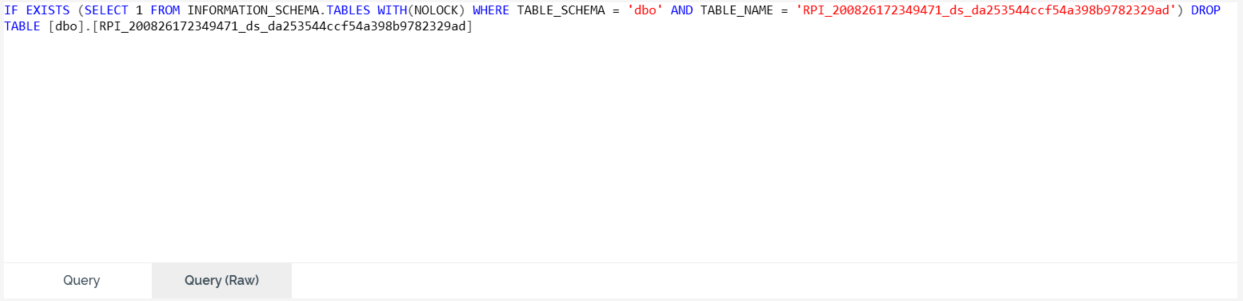
Selected Query Trace Log details
This section contains three tabs:
-
Query: this tab displays a formatted read-only representation of the currently-selected Query Trace log entry. You can copy the entry to the clipboard if required.
Query (Raw): this tab displays an unformatted read-only representation of the currently-selected Query Trace log entry. You can copy the entry to the clipboard if required.
Error Message: this tab displays a read-only representation of the error message associated with the currently-selected Query Trace log entry. You can copy the entry to the clipboard if required.