

Overview
A number of line, bar and pie charts are shown in the Realtime Details Report. Each is documented separately.
Information tooltips are shown when you hover over a chart.
You can change the date range displayed within a chart by shortening or lengthening the horizontal scroll bar displayed at the bottom of the line chart manually, or by using the mouse wheel.
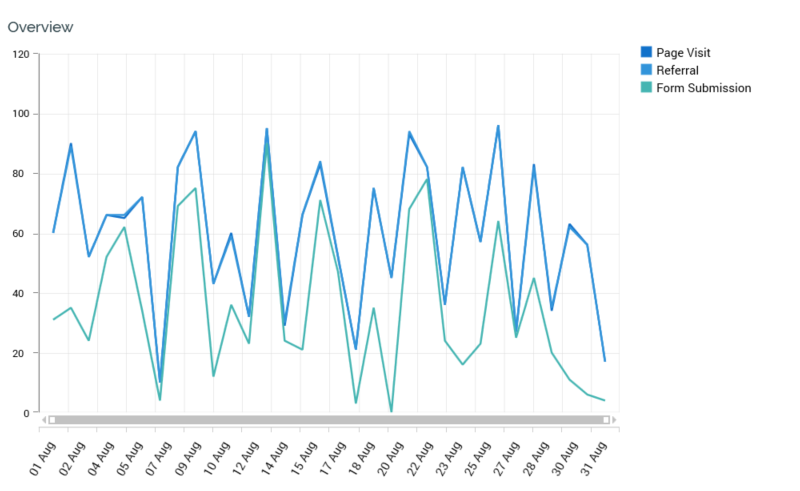
Overview chart
This line chart displays key metric trends across the selected date range. If a landing page contains goals, these are displayed in the line chart as well.
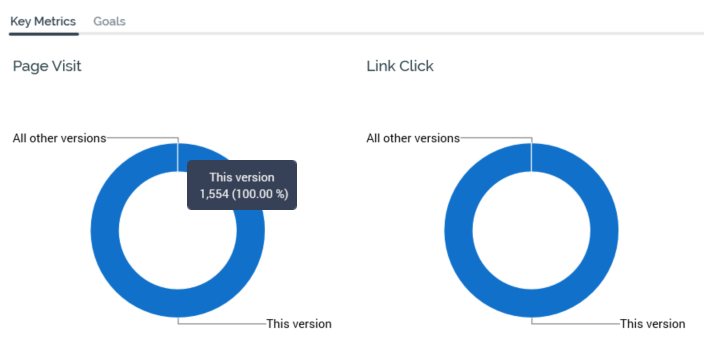
Key Metrics/Goals
This control contains Key Metrics and Goals tabs.
The Key Metrics Tab displays one pie chart is shown per available key metric or goal.
The Goals tab displays a Goal Conversion Rate Over Time chart.
Goal Conversion Rate Over Time
This chart displays the attainment of goals across time.
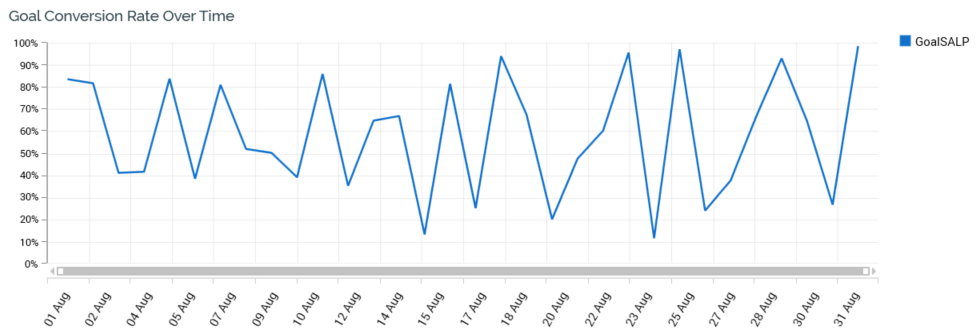
Each goal’s conversion rate is displayed at the chart’s legend.
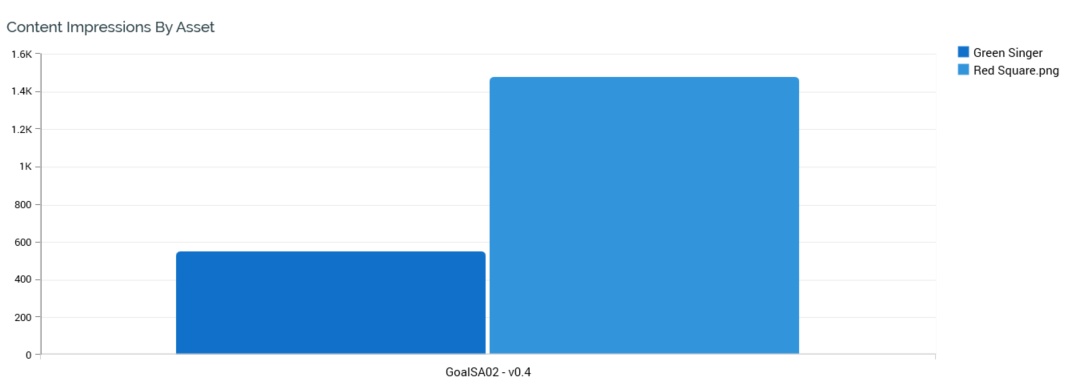
Content Impressions By Asset
This bar chart displays one bar per piece of content. Within each bar, one section is shown per rendered content element.
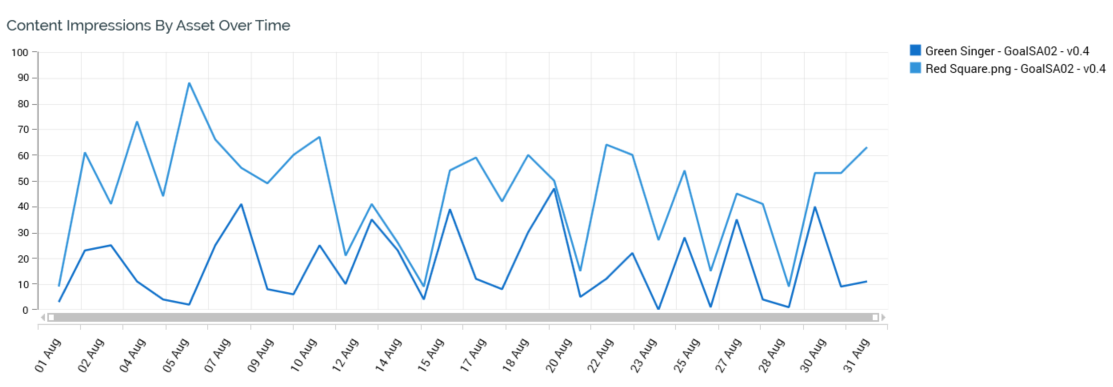
Content Impressions By Asset Over Time
This line chart displays the trend of all of a smart assets' content element’s being rendered across the selected date range.
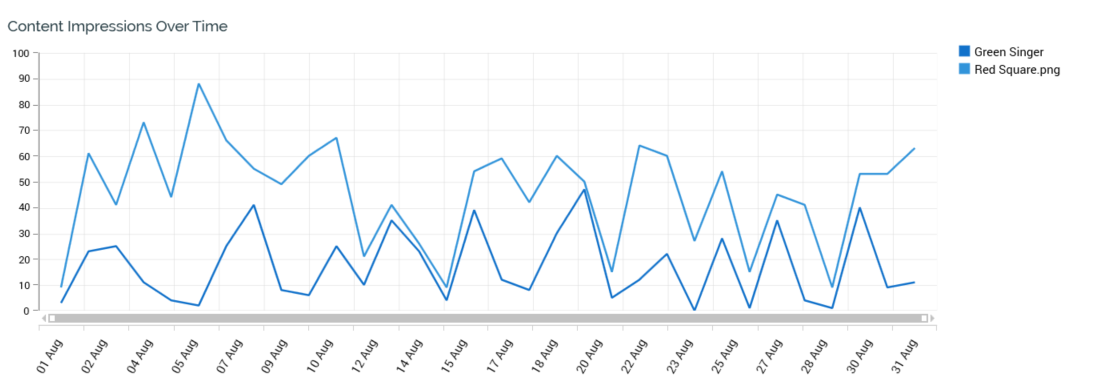
Content Impressions Over Time
This line chart displays the trend of the selected smart asset's content elements being rendered across the selected date range.
Content Impressions
This pie chart displays the currently-selected smart asset's content elements viewed as a proportion of the total impressions.
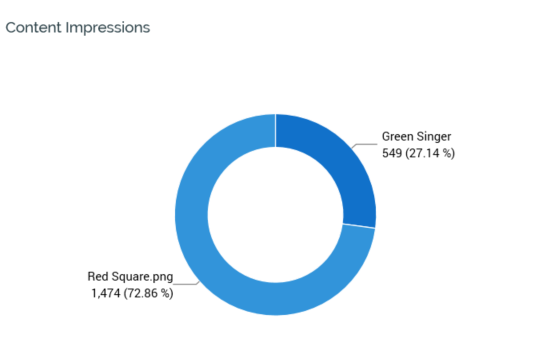
You can select a segment to populate the Selected Content Preview section. Selecting a segment again deselects it.
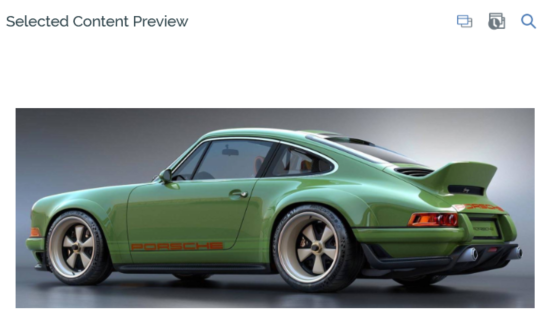
Selected Content Preview
This section displays a preview of the selected content element.
The following buttons are available in respect of the content element:
-
Open latest version of the Asset
-
Open this version of the Asset
-
View File Information
In addition, if the version of the content element published within the smart asset was not the latest, selecting the Open This Version button opens the historical version of the content element. Open This Version is also available if a web form asset version is selected at the Total Version Form Submissions pie chart.
If the selected content element is a smart asset that exposes no default content, a message (“No default content available for the selected asset”) is displayed instead of the preview.
The selected content preview section is not displaying when viewing selection rule or Realtime decision results.
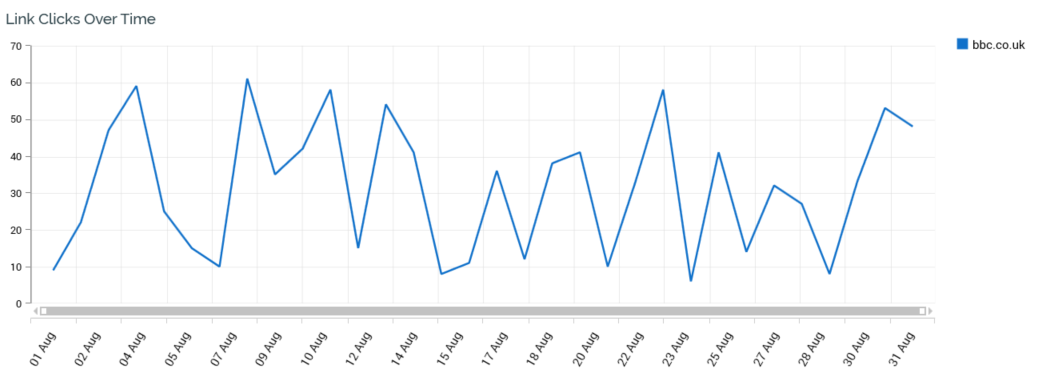
Link Clicks Over Time
This line chart displays the trend of links being clicked across the selected date range.
Total Version Link Clicks
This pie chart displays details of links clicked.
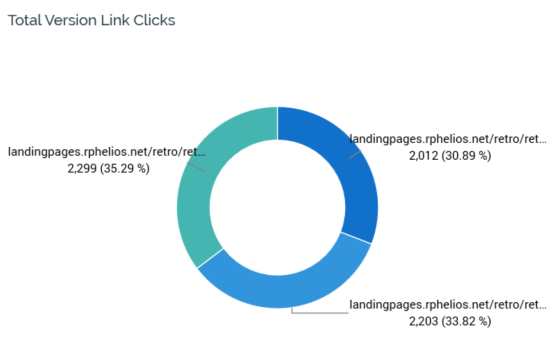
You can select a segment to populate the Selected Link Details section. Selecting a segment again deselects it.
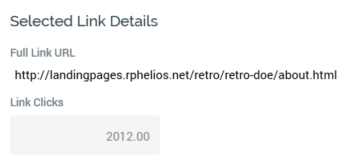
Selected Link Details
When a pie chart segment is selected, the following read-only link properties are displayed:
-
Full link URL: a hyperlink, which you can select to open in your default browser. A context menu, displayed when right-clicking the property, exposes Copy Link To Clipboard functionality.
-
Link clicks: the number of times the link was clicked in the current version of the landing page.
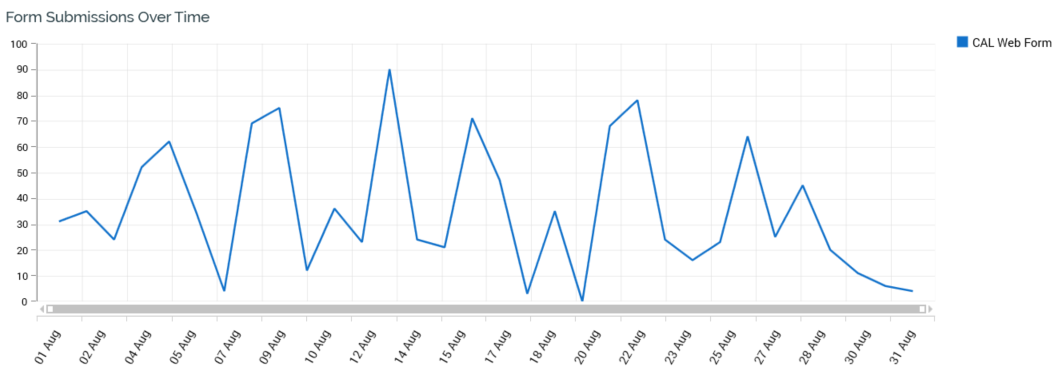
Form Submissions Over Time
This line chart displays the trend of the web forms being submitted across the selected date range.
Total Version Form Submissions
This pie chart displays details of submitted web forms.
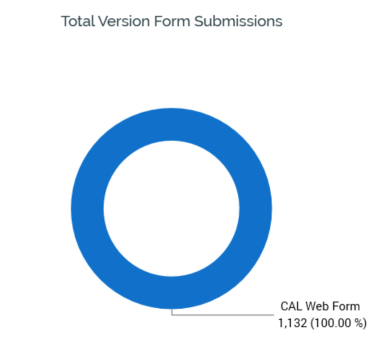
You can select a segment to populate the Selected Web Form Details section.
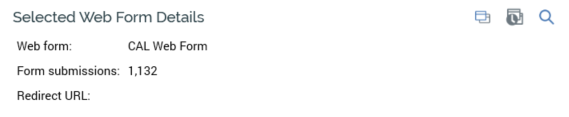
Selected Web Form Details
This section is displayed when the Web Forms node is selected at the treeview.
When a segment in the Total Version Form Submissions pie chart is not yet selected, a message is displayed that states “Select a slice rom the pie chart to view details”.
When a pie chart segment is selected, the following are displayed:
The accompanying menu exposes the following options:
-
Open Latest Version: you can select this button to open the web form in the Asset Designer.
-
Web form: the name of the RPI web form file.
-
Form submissions: the number of times the web form was submitted in the current version of the landing page.
-
Redirect URL: a hyperlink, which you can select to open in your default browser. A context menu, displayed when right-clicking the property, exposes Copy Link To Clipboard functionality.
Referrals
This line chart is displays referrals over time.
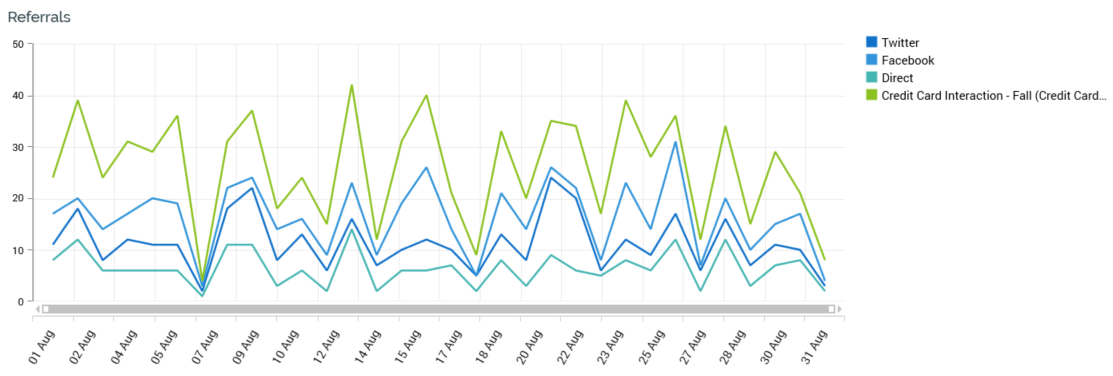
The following information is displayed at its legend:
-
If referred from a web page, the URL is shown.
-
If referred from an RPI offer, “[Interaction Name] ([Offer Activity Name] / [Offer Activity Channel Name])” is shown. Note that outbound channels must be associated with a web events or Matomo adapter for referral results to be captured.
-
If referred directly from a social post, the following are displayed (as appropriate):
-
Facebook
-
Twitter
-
-
If visitors were not referred, Direct is shown.
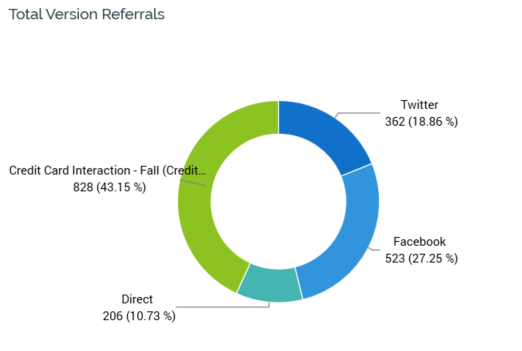
Total Version Referrals
This pie chart displays the breakdown of contexts from which visitors were referred.
Selected Referral Details
This section is displayed when the Referrals node is selected in the treeview, and a segment is selected in the Total Version Referrals pie chart.
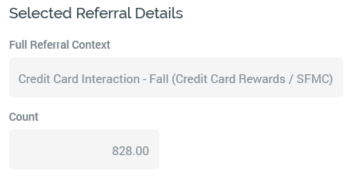
It displays the Full referral context represented by the pie segment, along with a count of visitors referred from the same.
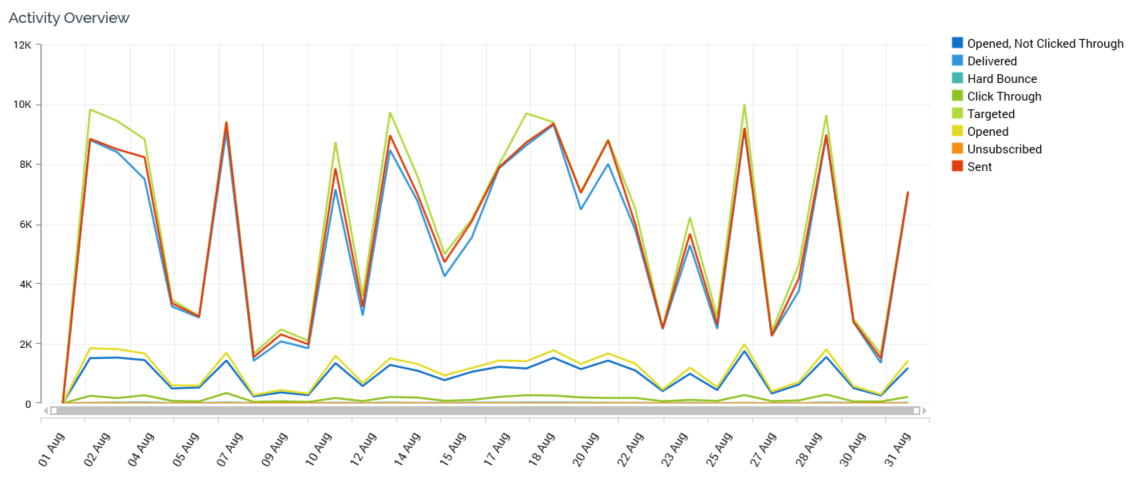
Activity Overview
This line chart is displayed when an interaction activity is selected in the treeview. It displays results for the selected activity over time.
Landing Page: Default content
This section is only displayed when a landing page version is displayed in the Realtime Details report. It displays a screenshot of the rendered landing page, with any default content rendered therein. Note that the screenshot’s availability is contingent on the landing page’s Generate preview checkbox having been checked at the time of its being published.
A button is displayed to the top right of the section:
-
Show/hide Dynamic Content locations on this Landing Page: selecting this button displays a numbered overlay over each smart asset included within the landing page.
Utilization Over Time
This line chart displays the trend of content served by the smart asset being rendered, by landing page version, across the selected date range.
A tooltip is shown when you hover over the chart, at which are displayed the landing page versions in which the smart asset was used, along with a count of impressions of the smart asset at a given date.
Utilization
This pie chart that displays the landing pages in which content was served by a smart asset, as a proportion of all impressions.
Goal Smart Asset Result
This section is shown to the bottom left of the Realtime Details report when a landing page version is displayed therein, and a goal smart asset is selected in the treeview.
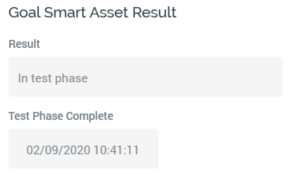
It displays the following:
-
Result: this property displays the most recent result of the goal smart asset’s being tested:
-
In test phase: in the test phase.
-
No Winner: indicates that the most recent test was unable to establish a winning content element.
-
Winner selected: indicates that one content element was determined to be statistically significantly better than the alternatives.
-
-
Winning asset: the name of the winner is displayed. You can navigate to the asset’s latest version using the button supplied.
-
Information: provides additional detail to help qualify the result.
-
Last evaluation: date/time.
-
Next evaluation: date/time.
-
Test phase complete: date/time.
Message Impressions By Variant
This bar chart lists an advanced smart asset’s variants.
For each, the count of message impressions (plus impressions of the default variant content) for the current smart asset version is displayed.
Message Impressions By Variant Over Time
This line chart displays the count of impressions of each message at each variant (plus each variant’s default content) over time.
Message Impressions Over Time
This line chart displays the count of message impressions (plus impressions of default content) at the selected variant, across time.
Message Impressions
This pie chart displays the count of rendered message impressions at the current variant.
The count of impressions of the variant’s default content can also be shown (if appropriate).
Selected Variant Preview
This section displays a preview of the message content selected within the Message Impressions pie chart.
When a pie chart segment is not yet selected, a message is shown:
When a pie chart segment is selected, a preview of the selected content is displayed.
The following buttons are available in respect of the content element:
-
Open latest version of the advanced smart asset
-
Open this version of the advanced smart asset
-
View file information…