

Overview
The Server & Client Log tab gives you access to RPI server and client log entries.
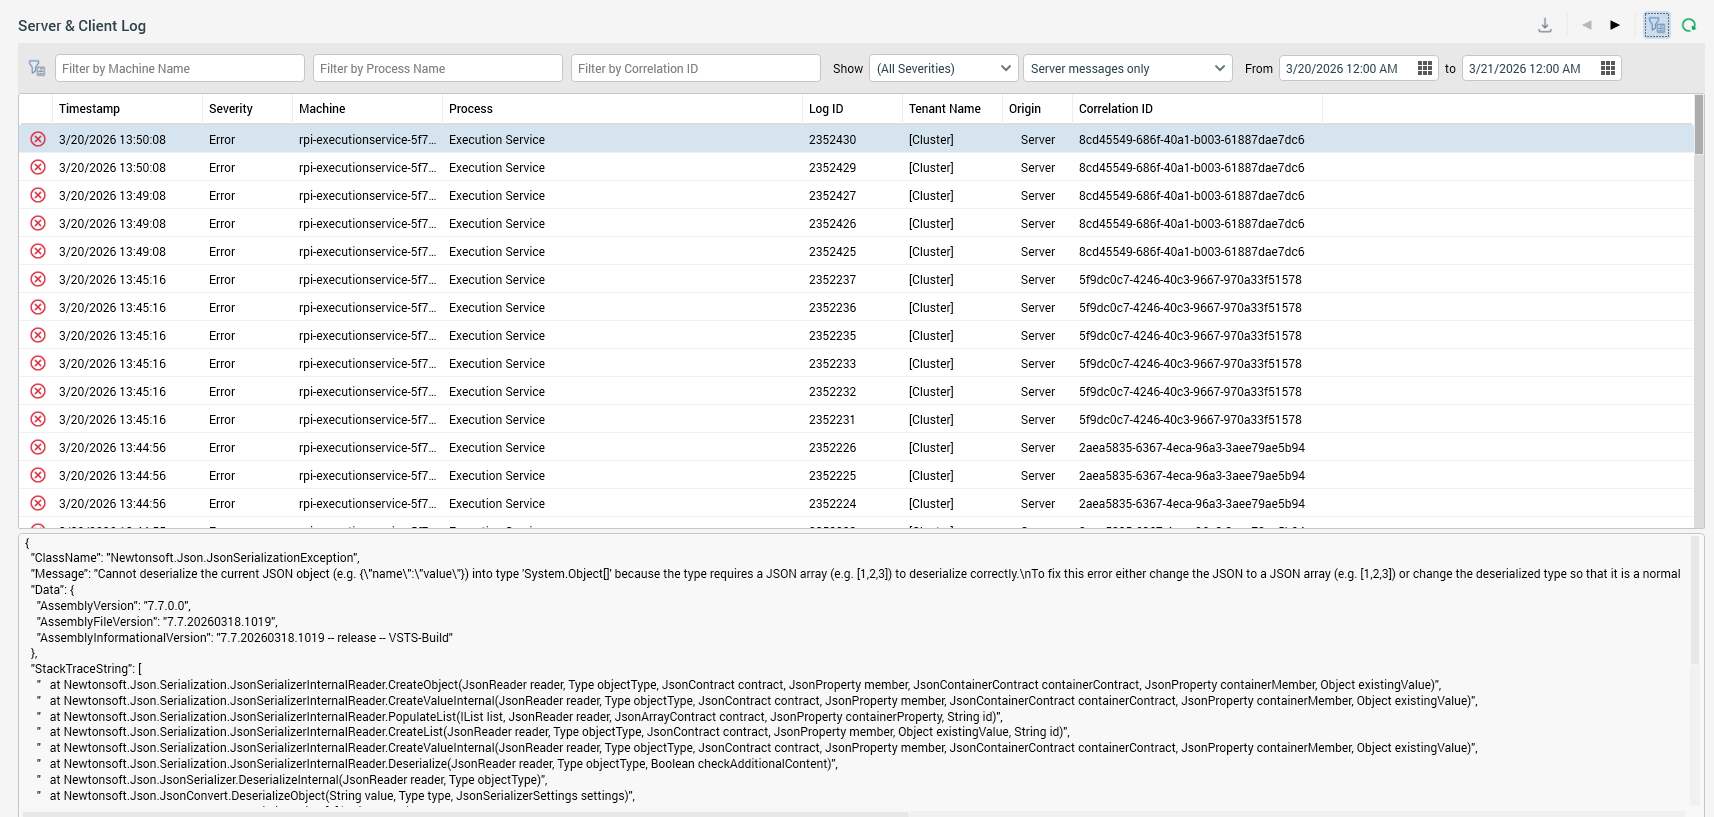
It contains a toolbar, Server & Client Log entries grid, and selected log entry details.
Toolbar
The Server & Client Log toolbar exposes the following:
-
Export Log: this option allows you to export the displayed log file entries to a text file. Invocation presents the Windows file system dialog to allow you to specify to where the file is to be saved.
-
Previous page: when more than one page’s worth of log file entries are available, and you have navigated past the first page, the Previous page button is available. Clicking it shows the previous page of results.
-
Next page: when more than one page’s worth of log file entries are available, and you are not displaying the final page, the Next page button is available. Clicking it shows the next page of results.
-
Show/Hide Server & Client Log Search Options: this toggle button controls display of the search options toolbar. It is selected by default.
-
Search: selecting this button initiates a search in accordance with the supplied search criteria and displays the matching log entries in the Server & Client Log entries grid.
The search options toolbar exposes the following filter options:
-
Filter by Machine Name: this text field allows you to specify the name of the server and/or client machine in respect of which log messages were written. It defaults to blank.
-
Filter by Process Name: this text field allows you to filter by the process name displayed in the column of the same name.
-
Filter by Correlation ID: this text field allows you to filter the list of log messages to display only those with a specific correlation ID. Refer to the Framework: Errors and warnings topic for further information.
-
Show: two dropdowns are displayed:
-
The first allows you to specify whether to show all logs (the default), or just those of a specific severity (Critical, Error, Information or Warning).
-
The second exposes values Client messages only, Server messages only and Both client and server messages. On closing and re-displaying the Operations interface, your most recent selection is applied.
-
-
From: the first date and time from which point log entries are to be displayed. Date from defaults to 00:00 today.
-
to: the last date and time to which point log entries are to be displayed. Date to defaults to tomorrow, 00:00.
Any specified filter options are applied automatically at Search invocation.
Server & Client Log grid
The grid is populated automatically on displaying the tab for the first time, in accordance with the default search criteria.
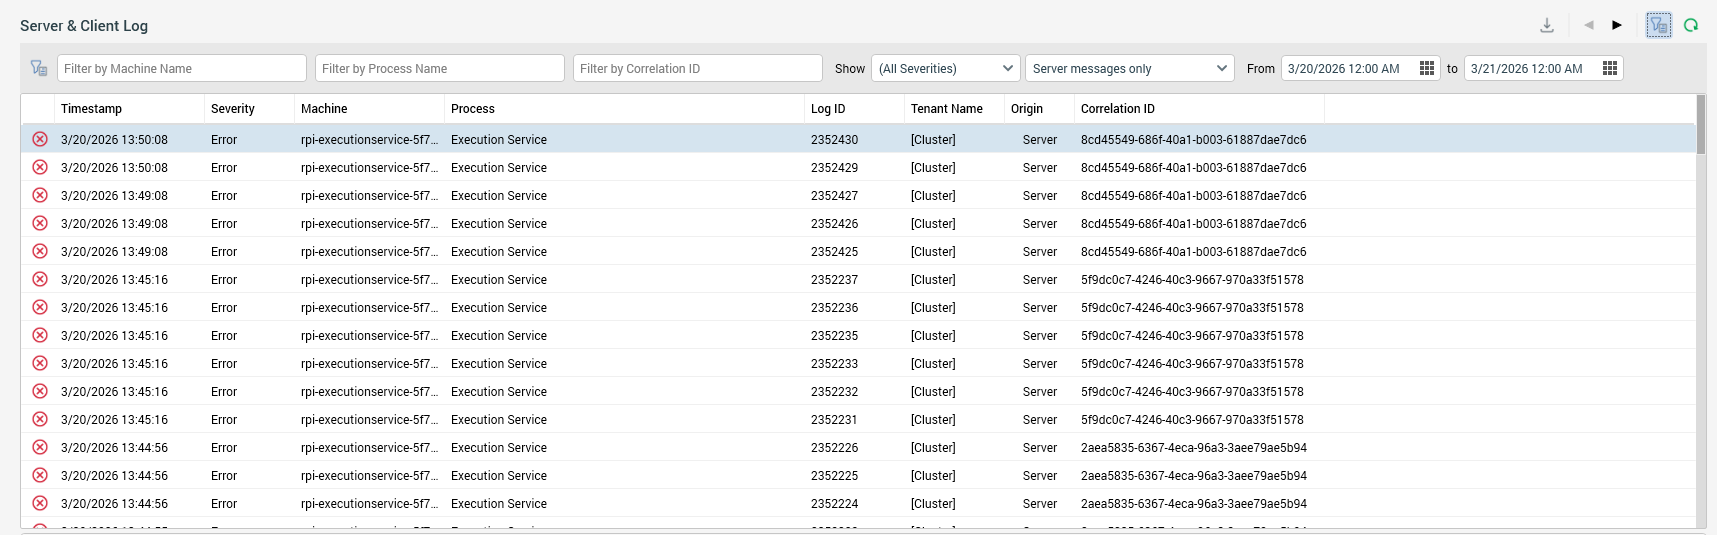
Following subsequent execution of a search, any matching log entries are listed in the Server & Client Log grid. If no matching entries exist, a message is displayed. For each log entry, the following properties are displayed:
-
Timestamp
-
Severity
-
Machine
-
Process
-
Log ID
-
Tenant Name: when logged in as a cluster administrator, non- tenant specific entries can be viewed in the Server & Client log. At the same, the Tenant Name property is set to the value "Cluster". When not a cluster admin, non- tenant entries are not shown.
-
Origin (Server or Client)
-
Correlation ID: when an error occurs during RPI operation, a Correlation ID GUID property is applied to the error as logged. You can copy/paste the Correlation ID as needed. Learn more about the Correlation ID.
Selected log entry details
You can select on a log entry in the results grid to view its read-only details at the bottom of the server trace logs tab.
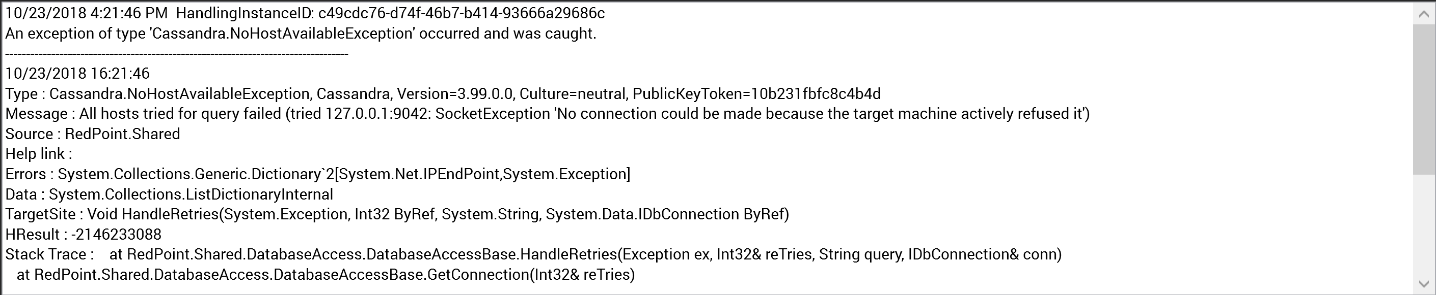
If required, you can highlight the contents of the field and copy them to the clipboard.