

Overview
The System Health tab is displayed initially when you view the Operations interface.
It provides an overview of the state of the current tenant’s RPI server installation, highlighting any issues that may require attention and painting a picture of the current overall health of the system.
The System Health task is composed of the following sections:
System Health overview
This section contains a toolbar and treeview representation of the health of the current tenant ’s RPI installation.
Toolbar
The System Health Overview toolbar exposes the following:
-
System Health Task last ran: [date/time]: the date and time at which System Health information was most recently refreshed. The information displayed when you refresh System Health & Tasks reflects the state of the system at the most recent execution of the System Health Monitor task and may not reflect with 100% accuracy the current state of the system (depending on when that task ran).
-
Run System Health Monitor Tasks: to gain an accurate understanding of the current state of system health, you can invoke this option, which executes the Client Health Monitor and System Health Monitor tasks. Note that the button is disabled while the task is running.
-
Export System Health: invocation of this option displays the Save System Health Details Windows file system dialog, with which the Default file type is set to Text Files, the default file name to "System Health [yyyy]-[mm]-[dd]" and the default folder to the folder within which the client application is running. You can select Save to save the system health details to a file, or you can select Cancel to close the dialog without saving. The file thus generated contains the system health hierarchy as displayed in the System Health Overview. For each element in the hierarchy, the following are displayed:
-
Name
-
Health
-
Healthy
-
Warning
-
Attention Required
-
-
Description
-
-
Refresh: selecting this button loads the most up-to-date system health information available.
Treeview
The System Health Overview treeview provides a series of health indicators that together provide an immediate understanding of the current state of the RPI server.
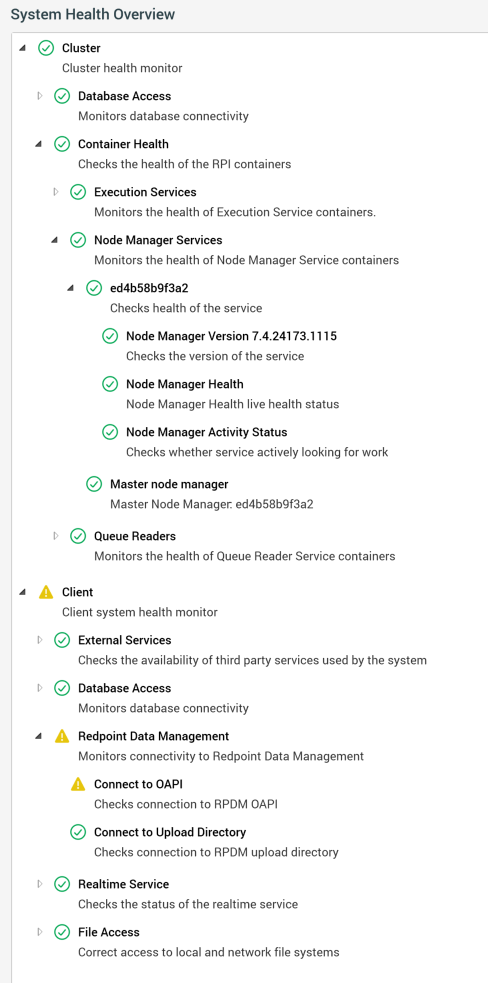
Each element in the treeview is shown as being in one of three states:
-
Healthy
-
Warning
-
Attention Required
The overall status of a parent node is determined by the collective statuses of its descendant nodes. If all of its descendants are healthy, the parent node is deemed also to be healthy. If one or more warning descendant nodes are present, but none required attention, the parent is in a warning state. If one or more descendants require attention, the parent node also requires attention (irrespective of the presence of descendants in a warning state).
When a leaf node is in a warning state or requires attention, when you select it, a checkbox is displayed:
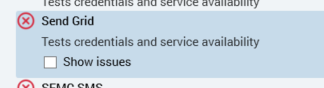
Checking the checkbox displays the issue’s details:
If you highlight another treeview node, the issue’s details are removed from display. They are redisplayed when you highlight the node again.
The treeview contains the following nodes:
-
Cluster: this node contains details about the current state of health of the server’s cluster core. It contains the following nodes:
-
Database Access: describes the current connectivity state in respect of the following cluster databases:
-
Pulse database: the cluster core’s operational database
-
Logging database: the database to which log messages from across the cluster are written.
-
For each Windows services role in the cluster:
-
Workflow database on [server] (ID:[n]): the database in which the Windows service’s workflows are persisted.
-
-
-
Container Health: describes the state of health of the cluster’s containers (Execution Service, Noed Manager and Queue Reader. In addition, the master Node Manager container is displayed.
-
-
Client: this node describes the state of health of the current tenant. The following are monitored:
-
AML Service: this node describes the current status of RPI’s connection to the Redpoint Automated Machine Learning (AML) API.
-
External Services: this node describes the availability of third party services used by the tenant (channels, FTP locations and web adapters).
-
Database Access: tests connectivity to the following databases:
-
Operational database
-
Audit database
-
Data warehouse
-
Auxiliary database(s) (if configured)
-
-
Redpoint Data Management: this node describes the current state of the RPDM instance configured within RPI. Both the Operational API (OPAI) and Upload Directory are checked.
-
Realtime Service: this node describes the current state of the current RPI Realtime service.
-
File Access: this node describes the current state of access to local and network file systems, specifically to the system output folder.
-
System Health Performance Monitors
The lower half of the System Health tab displays a series of categorized metric values that provide insight into the current performance of the RPI server.
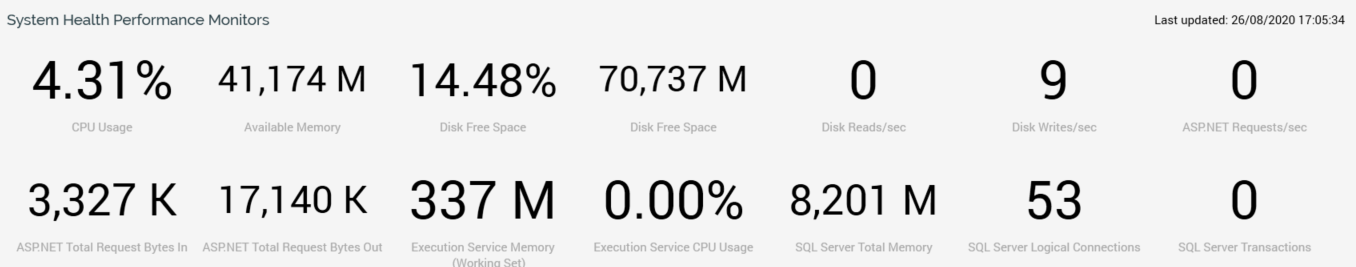
The section contains the following:
-
Last updated: the date and time at which the metrics were most recently refreshed. Note that metrics are updated in real-time on invocation of the Refresh button, rather than reflecting the most recent results of execution of the System Health task
-
Hardware: these metrics relate to the server hardware upon which RPI is installed. The following metrics are displayed:
-
CPU Usage (%): note the percentage shown here represents the sum of usage across all CPUs, hence the value shown may exceed 100%.
-
Available Memory (M): this metric shows % Committed Bytes In Use. This represents is the ratio of Memory – Committed Bytes to the Memory – Commit Limit. Committed memory is the physical memory in use for which space has been reserved in the paging file should it need to be written to disk. The commit limit is determined by the size of the paging file. If the paging file is enlarged, the commit limit increases, and the ratio is reduced). This counter displays the current percentage value only; it is not an average.
-
Disk Free Space (%)
-
Disk Free Space (M)
-
Disk Reads/sec
-
Disk Writes/sec
-
-
.NET: these metrics relate to the http://Microsoft.NET framework that underpins RPI. The following metrics are displayed:
-
http://ASP.NET Requests/sec
-
http://ASP.NET Total Request Bytes In (K)
-
http://ASP.NET Total Request Bytes Out (K)
-
-
Services: these metrics relate to the core Windows services that help comprise RPI. The following metrics are displayed:
-
Execution Service (Working Set)
-
Execution Service CPU Usage
-
-
SQL Server: these metrics are only shown if the RPI data warehouse is running on the Microsoft SQL Server platform. The following metrics are displayed:
-
SQL Server Total Memory
-
SQL Server Logical Connections
-
SQL Server Transactions
-
The display of SQL Server performance metrics is controlled by system configuration setting SQLPerformanceCountersEnable.
If the system is unable to retrieve data for a metric, a cross icon is shown. Failure details are shown as a tooltip when you hover over the cross.