

Overview
The System Tasks tab is used to list and provide control over a series of tasks that are executed in the background by the RPI Task Manager Windows service.
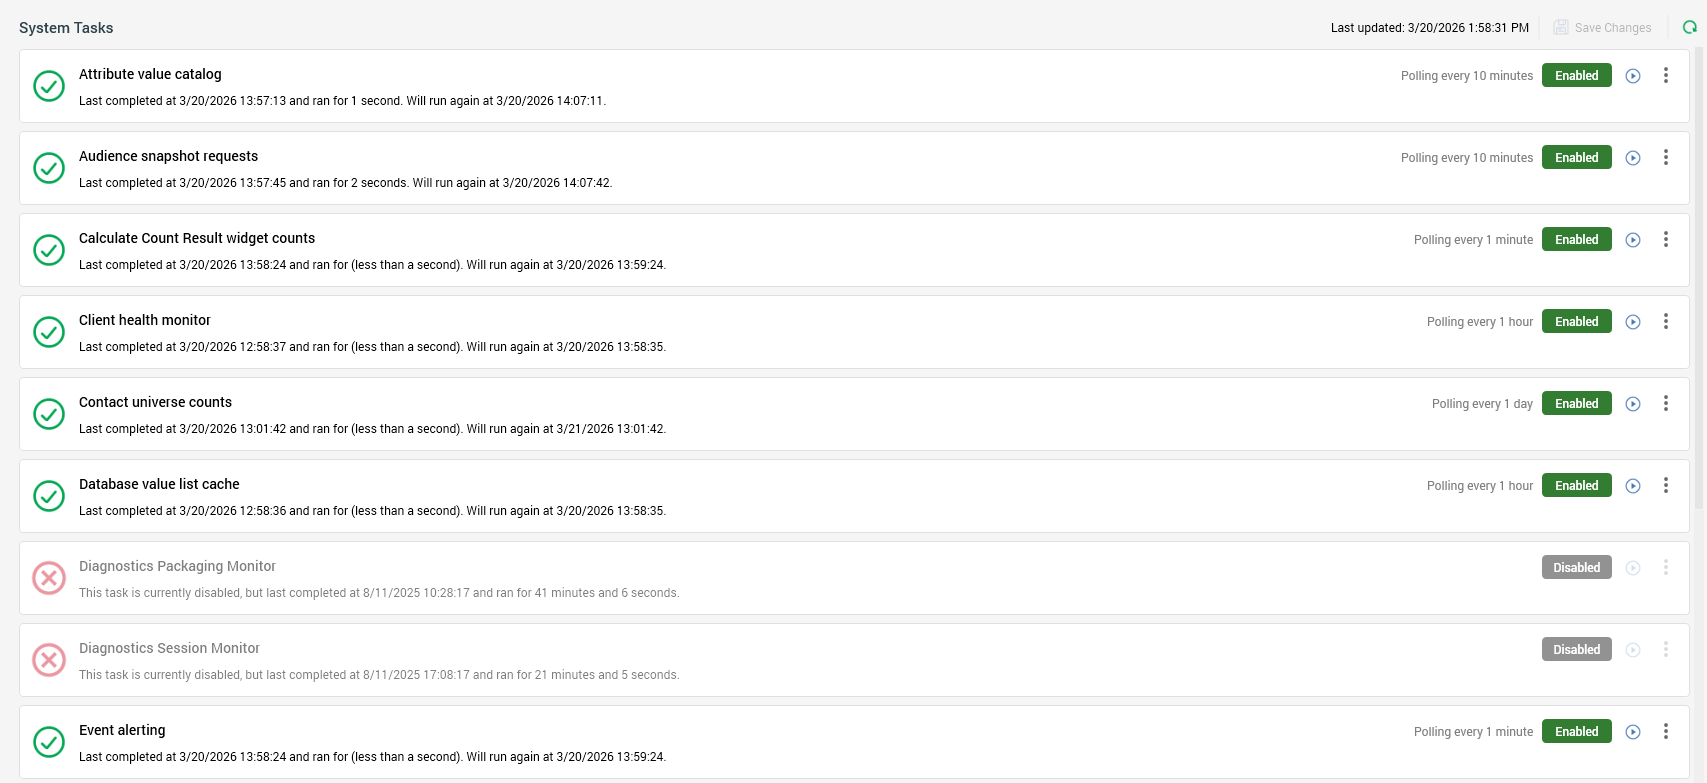
These tasks serve a variety of purposes, and each is documented separately below. The System Tasks tab contains a toolbar and the System Tasks list.
Toolbar
The toolbar exposes the following:
-
Last updated: the date and time at which the list of system tasks was last refreshed. Refreshing tasks allows their current states (e.g. Last run succeeded, Running, etc.) to be displayed.
-
Save Changes: this button is available when change(s) have been made to one or more tasks' Enabled status or Schedule details. Invocation persists the changes and removes from display the orange label displayed when outstanding changes are present. Following a successful Save, the list of tasks is refreshed to display their current statuses. Note that enabling or disabling a system task, or editing its schedule, generates an audit record.
-
Refresh: selecting this button reloads details of the system tasks.
System Tasks list
This section lists system tasks in alphabetical order. The following tasks are listed:
-
Attribute value catalog: this task is responsible for the initial collation of and ongoing update of attributes’ lists of values. On execution, the task checks if there are any attributes that are due to be refreshed (in accordance with the
AttributeRefreshIntervalsetting—e.g. refresh every 30 days). The lists of values of any that are due are updated.
If system configuration setting AttributeRefreshColumnsOnly is set to True, on execution of the task, only database column attributes' values are refreshed. If set to False, all attributes' values are refreshed.
-
Audience snapshot requests: monitors for the insertion of data into data warehouse table
RPI_DataflowSnapshotRequests. If the value inserted matches the external key of an existing audience snapshot, the snapshot in question is executed and an audience instance created. -
Calculate Count Result widget counts: this task is responsible for calculating counts and aggregate counts for any configured count results widgets. At its execution, it snapshots counts and aggregate counts of the selection rules with which count results widgets are configured.
-
Channel [channel name] data synchronization: one task is shown for each channel. These tasks are responsible for the retrieval of results data provided by third-party channel providers. Each task is created at the point of the channel’s creation and is deleted when the channel is deleted.
-
Client Health Monitor: it is this task’s responsibility to perform system health checks specific to the current tenant to which the RPI client application is connected. Its most recent results are displayed in the System Health task when Refresh System Health & Tasks is invoked. Upon completion of the task, if Attention Required issues or Warnings were discovered, email alerts are sent to those users who have subscribed to the relevant alert types. If the task is unable to connect to the data warehouse, unlike other scenarios, a series of attempts to make a connection are not repeated over a ten-minute period—rather than delaying the display of system health, the database connection is assumed to require attention immediately.
-
Contact universe counts: updates cached values for audience contact universe counts.
-
Database value list cache: this task runs every hour by default. It updates all database value lists where Disabled value cache is unchecked. Cached values are then available at next sign in.
-
Event Alerting: on execution of this task any new alert emails scheduled for delivery due to occurrence of system events at the current tenant are sent to appropriate users.
-
Export backfill state data: this task exports offer history state data for any audience definition at which backfill files are configured to be generated. When available, by default, the task polls for data every minute. When data is found, it generates an offer history states backfill file (
[Table name]_States_[GUID]). If the Export channel metrics property is checked at the audience definition, channel execution results files are generated (op_ChannelExecutionResults_[GUID], query typeUPSERT). -
Fulfillment state flow count updates: this task is responsible for collecting custom state flow counts for fulfillment activities (e.g. offers and exports) within interactions.
-
Goal smart asset monitor: this task is used to effect A/B/n testing, and machine learning algorithm invocation, for goal smart assets. Full details of goal smart assets can be found in the Smart Asset Designer documentation.
-
Housekeeper: it is the job of this task to control the housekeeping activities listed within the Operations Housekeeping tab (e.g. Workflow system and File system housekeepers).
This task is only visible in a multi-tenant environment to users who are cluster admins.
-
License expiry: this cluster-level system task checks whether the current RPI server is scheduled to expire within the next 30 days. The task is enabled by default, and is scheduled to run every day at 0900. The delivered email contains the license type, expiry date and number of days to expiry.
-
Queue activity content monitor: this task is disabled by default. When available, it defaults to polling every hour. At its execution, the task looks for active queue activities configured with offers. When it finds the same, it checks if the offer, or any nested content within, has been updated. If it has, the task checks if offer content needs to be re-staged, and does so if appropriate.
-
System Health Monitor: this job is used to determine the state of health of the current tenant’s RPI installation’s cluster core. Its most recent results are displayed in the System Health task when Refresh System Health & Tasks is invoked. Upon completion of the task, if Attention Required issues or Warnings were discovered, email alerts are sent to those users who have subscribed to the relevant alert types.
For each system task, the following are shown:
-
Status icon: illustrates the current state of the task. A tooltip is shown on hover that states “Last run succeeded”. A task’s status may be one of the following:
-
Last run succeeded
-
Last run failed
-
Run requested
-
Running
-
-
Name: a descriptive tooltip is shown on hover stating “Monitors for external requests to refresh audience snapshots”.
-
Last completed… details: the date and time of the task’s most recent execution are displayed, along with the date and time at which the task is next scheduled to run, in the following format.
-
If a task is Disabled, the message “This task is disabled” is displayed instead of its Last completed… details.
-
If a task is Enabled, and its status is Run requested or Last run succeeded, its Last completed… details continue to be shown.
-
If a task is Enabled, and its status is Running, its Last completed… details are replaced by the message “Now running”.
-
If a task’s Enabled status is changed, or its schedule updated, its Last completed… details are replaced by the message “Save Changes to complete the update to this task's schedule”.
-
Polling/Schedule details: these are displayed to the top right of the task. Its manner of display is dependent on whether the task is defined as executing on a daily basis at a specific time or whether defined as executing at a periodic interval:
Polling/Schedule details are only displayed if the task is Enabled.
-
Enabled/Disabled: this button is displayed to the left of the task. By default, tasks are Enabled. Selecting the toggle button changes the task’s current Enabled state to either Enabled or Disabled.
When you change a task’s Enabled status, an orange message is shown at the top of the list of system tasks that says “Task status updates are currently suspended and will be resumed after the changes have been saved”.
In addition, its Last completed… details are replaced by the text “Save Changes to complete the update to this task's schedule”.
Selecting Save Changes at the System Tasks toolbar persists the change to the task’s Enabled status (along with any other outstanding changes) and removes the message from display.
A task’s Enabled status has an effect upon its display:
If a task is Disabled, the following message is displayed instead of its Last completed… details.:
“This task is currently disabled, but last completed at [date/time] and ran for [duration]”
Its Polling/Schedule details and Edit Schedule and Run Task Now buttons are not shown.
If a task is Enabled, and its status is Run requested, its Last completed… details continue to be shown, as do its Polling/Schedule details. Edit Schedule remains available, but the Run Task Now button is unavailable.
If a task is Enabled, and its status is Running, its Last completed… details are replaced by the message:
“Now running. Started at [date/time]. Last completed at [date/time] and ran for [n] [units]. Will run again at [date/time]”.
Edit Schedule remains available, and the Run Task Now button is unavailable.
If a task is Enabled, and its status is Last run succeeded, its Last completed… details and Polling/Schedule details are displayed. Both Edit Schedule and the Run Task Now button are available.
-
Run Task Now: this button is only available if the task is Enabled. Invocation sets its status initially to Run Requested, then to Running.
-
Actions button: exposing Run Task Now and Edit Schedule options (each covered separately).
-
Run Task Now: this option, accessible from the Actions button’s menu, is only available if the task is Enabled. Invocation sets its status initially to Run Requested, then to Running.
-
Edit Schedule: this option, accessible from the Actions button’s menu, is only available if the task is Enabled. It allows you to define when the task will execute. Invocation displays the Edit System Task Schedule dialog. A radio button allows you to define whether the task will run:
-
Every day at [hour] : [minute].
-
Every [n] day(s) [hours] : [minutes] : [seconds].
-
When you change a task’s schedule, an orange message is shown at the top of the list of system tasks stating “Task status updates are currently suspended and will be resumed after the changes have been saved”.
In addition, its Last completed… details are replaced by the text “Save Changes to complete the update to this task's schedule”.
Selecting Save Changes at the System Tasks toolbar persists the change to the task’s schedule (along with any other outstanding changes) and removes the message from display.
-
Error details: these are only shown when you highlight a task with a Last run failed status. You can copy the error details to the clipboard.
System Task Execution metrics
Metrics relating to system task execution can be persisted in the SystemTaskExecutionHistory table, which can be found in the Pulse_Logging operational database. This can be enabled by setting the Execution Service's PersistTaskExecutionDetails application setting to value true. The following information is captured at execution of each system task:
-
Client ID
-
Task Name
-
Task Details
-
Start Timestamp
-
End Timestamp
-
Duration
-
Completion Status
-
Error Message
Records in the table are removed by housekeeping after a default 14 days.