

Overview
The Workflow Summaries tab gives you the ability to, at a glance, view a summary of those interactions, audiences and data connectors that utilize workflows to effect their execution, and which are or were in given states across a given period of time within the current tenant's RPI server installation.
The inclusion of audiences in this context refers to their execution as audience tests.
The video below shows a few ways to utilize Workflow Summaries.
The Workflow Summaries tab contains a toolbar, treeview, and selected item details section.
Toolbar
The Workflow Summaries toolbar exposes the following:

-
Previous Page: this option is only available when a previous page's worth of data is available. Invocation displays the previous page.
-
Next Page: only available when a next page's worth of data is available. Invocation displays the next page.
-
Show/Hide Workflow Summaries Search Options: this toggle button controls display of the search options toolbar. It is selected by default.
-
Search: selecting Search refreshes the treeview with a list of files matching the specified search criteria.
The search options toolbar exposes the following filter options:
-
Filter by file name: this text field allows you to limit the search for files in order to display to only those with names matching the specified search string.
-
Show: a dropdown field that exposes the following values:
-
All statuses
-
Completed
-
Expired
-
Failed
-
Paused
-
Playing (the default)
-
Requested
-
Rolled Back
-
Stopped
-
Waiting
-
When a search is executed, a file is displayed if at least one workflow or activity therein is or was in the selected status within the selected time period (subject to any other search options applied).
-
First activated/Most recent activity from: this dropdown field gives you control over the manner in which date comparisons are executed when searching for records to display. By default, the field is set to "Most recent activity from", but you can also choose to search against dates when workflows were "First activated".
-
[From]: a date/time value that defaults to today's date, 00:00.
-
to: a date/time value that defaults to tomorrow, 00:00.
Any specified filter options are applied automatically at Search invocation.
Treeview
On initialization, the treeview is populated with files matching the tab’s default search settings.
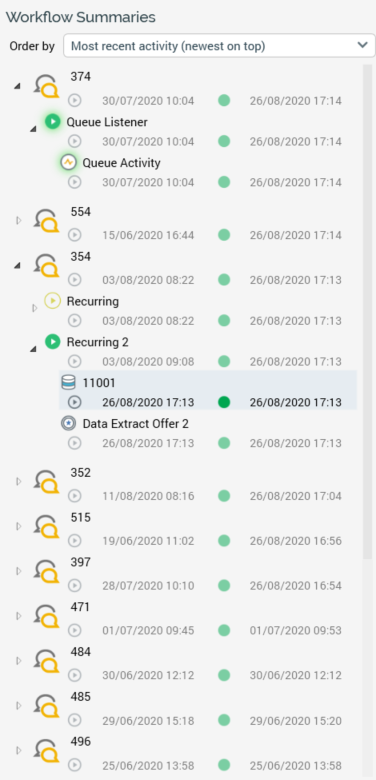
The following types of file are displayed:
-
Interactions
-
Audiences that have been subject to the execution of test instances that match the supplied search criteria
The treeview contains the following.
-
Order by: this dropdown allows you to select the manner in which treeview items are to be ordered. The available values are as follows:
-
File name
-
File type
-
First activated (newest on top)
-
First activated (oldest on top) (the default)
-
Most recent activity (newest on top)
-
Most recent activity (oldest on top)
-
Selecting a value re-orders the contents of the treeview accordingly.
-
Treeview items: For each top-level file shown in the treeview, the following are displayed:
-
Icon
-
One of interaction or audience.
-
-
Name
-
Description (shown in a tooltip when hovering over the file)
-
First activated
-
Most recent activity
-
-
Expanding a top-level file reveals a list of its workflows: Note that a workflow in an audience is named as per the template itself). For each workflow, the following are displayed:
-
Icon
-
A halo indicates the workflow’s status
-
-
Trigger name
-
For the most recent workflow instance:
-
First activated
-
Most recent activity
-
-
-
Expanding a workflow reveals a list of its activities: activities are ordered alphabetically by name. For each activity, the following are displayed:
-
Icon
-
Halo indicates the activity’s status
-
-
Activity name
-
First activated
-
Most recent activity
-
Selected Item details
A selected item details panel is displayed to the right of the treeview. It displays details of the currently-selected treeview item. Its contents are dependent on the type of item selected.
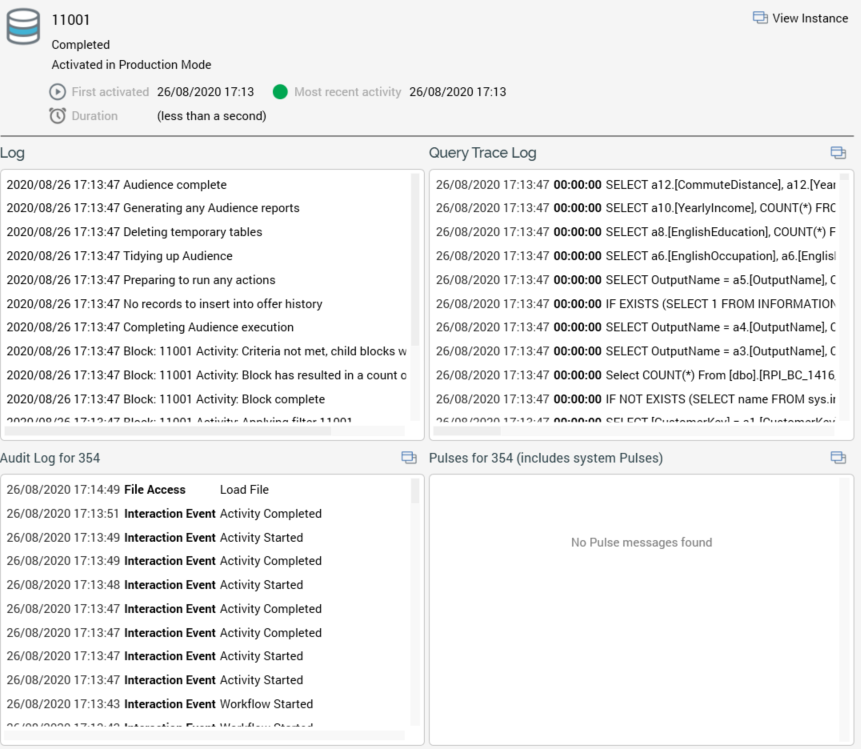
If an interaction, audience or data connector is selected at the treeview, the panel contains:
-
Icon: indicating the file’s type
-
File name
-
Description
-
First activated: "The date and time at which a workflow within the file commenced execution".
-
Workflows (active): "The count of workflows within the file that are currently in an active state (e.g. Playing or Paused)".
-
Workflows (executed): "The count of workflows in the file that have executed at least once".
-
Most recent activity: "The most recent date and time at which execution of a workflow activity occurred".
-
Activities (active): "The count of workflow activities in the file that are currently in an active state (e.g. Playing or Paused)".
-
Activities (executed): "The count of workflow activities in the file that have executed at least once".
-
Activities (queued): "The count of workflow activities in the file that are currently queued, pending execution".
-
Toolbar: exposing the following options:
-
Open latest version: invocation displays the file in its relevant designer.
-
Open file location: invocation displays the contents of the RPI file system folder in which the file is persisted in the File System Dialog and highlights the file in question.
-
-
Audit log: this section displays all audit log entries relevant to file in question
-
View in Audit Log tab button: displays the Operations Audit Log interface, filtering its contents to show only audit records relevant to the file in question.
-
-
Pulses: displays all pulses related to the current file, including system-generated pulses. Pulses are listed in reverse chronological order. Only displayed if system configuration setting
EnablePulseMessagesis set totrue.-
View in Pulses window button: invocation of this option displays the Pulses Window, in which pulses related to the current file are listed.
-
If a workflow is selected at the treeview, the panel contains:
-
Workflow icon: the icon’s color indicates its mode of execution, and its halo provides status information.
-
Trigger name
-
Status
-
Activated in Test | Production Mode
-
First activated: "The date and time at which the workflow commenced execution".
-
Activities (active): "The count of activities in the workflow that are currently in an active state (e.g. Playing or Paused)".
-
Activities (executed): "The count of activities in the workflow that have commenced execution".
-
Activities (queued): "The count of workflow activities in the file that are currently queued, pending execution".
-
Most recent activity: "The most recent date and time at which execution of an activity within the workflow occurred".
-
Workflow instance ID (most recent): "The unique ID of the most recently-created instance of the workflow".
-
Duration: "Total workflow duration from initial activation to most recent activity".
-
Toolbar: exposing the following options:
-
Change status to: a dropdown, exposing the following values:
-
Completed
-
Not started
-
Paused
-
Stopped
-
-
Change status to: invocation of this option displays a dialog. If you elect to proceed, the workflow instance’s status is set to the value selected at the Change status to dropdown.
-
Open Workflow Instance: displays the workflow instance in the Workflow Instance Viewer.
-
-
Audit log for [File Name]: this section displays all audit log entries relevant to the current workflow's file.
-
View in Audit Log tab button: invocation displays the Operations Interface’s Audit Log tab, filtering its contents to show only those audit records relevant to the current workflow’s file.
-
-
Pulses for [File Name]: this section displays all pulses related to the current workflow's file, including system-generated pulses. Pulses are listed in reverse chronological order. The section is only displayed if system configuration setting
EnablePulseMessagesis set totrue.-
View in Pulses window button: invocation of this option displays the Pulses Window, in which pulses related to current workflow's file are listed.
-
If an activity is selected at the treeview, the panel contains:
-
Icon: activity type-specific, with a halo that provides status information.
-
Activity name
-
Status
-
Activated in Test | Production Mode
-
First activated: "The date and time at which the activity commenced execution".
-
Most recent activity: "The most recent date and time at which execution of the activity occurred".
-
Duration: "Total activity duration from initial activation to most recent occurrence therein".
-
Toolbar: exposing the following option:
-
View Audience Instance: this option is only available when a batch audience or interactive activity configured with an audience is selected at the treeview. Invocation displays the audience instance in the Audience Instance Viewer.
-
-
Log: this panel displays log messages related to the activity's execution. Messages are presented in reverse chronological order.
-
Query Trace Log: this panel displays Query Trace log messages related to the activity's execution. Messages are presented in reverse chronological order. For each, the date/time, duration, and SQL statement are shown.
-
View in Query Trace Log tab: invocation of this option displays the Operations Interface’s Query Trace Log tab, filtered to only display Query Trace records relevant to execution of the activity in question.
-
-
Audit log for [File Name]: this section displays all audit log entries relevant to the current activity's file.
-
View in Audit Log tab button: invocation of this option displays the Operations Interface’s Audit Log, filtered to only display audit records relevant to the activity’s file.
-
-
Pulses for [File Name]: this section displays all pulses related to the current activity's file, including system-generated pulses. Pulses are listed in reverse chronological order. The section is only displayed if system configuration setting
EnablePulseMessagesis set totrue.-
View in Pulses window button: invocation of this option displays the Pulses Window, in which pulses related to current activity’s file are listed.
-