

Overview
The Crosstab tool is useful for looking at correlation of various variables within a table. Some examples of useful crosstab reports might be:
-
Count of Households by Income and Gender
-
Total Purchases by Zip and Ethnicity
-
Percent of Total Sales by Month, Territory, and 2-digit SIC
As you can see from these examples, crosstabs help determine the significance of data clusters and visualize value distributions in two or three dimensions. Crosstab reports integrate into Data Management's Structured Report system. They can be created in CSV, HTML or Text format, and can be integrated with other report output and organized by outline levels.
Crosstab reports have between one and three dimensions (depth, horizontal, and vertical) depending on how they are configured. The horizontal and vertical dimensions are the columns and rows, and the depth dimension is represented as "pages" or "layers." Page, row, and column headers generated by the Crosstab tool are sorted alphabetically.
Let's look at a simple example.
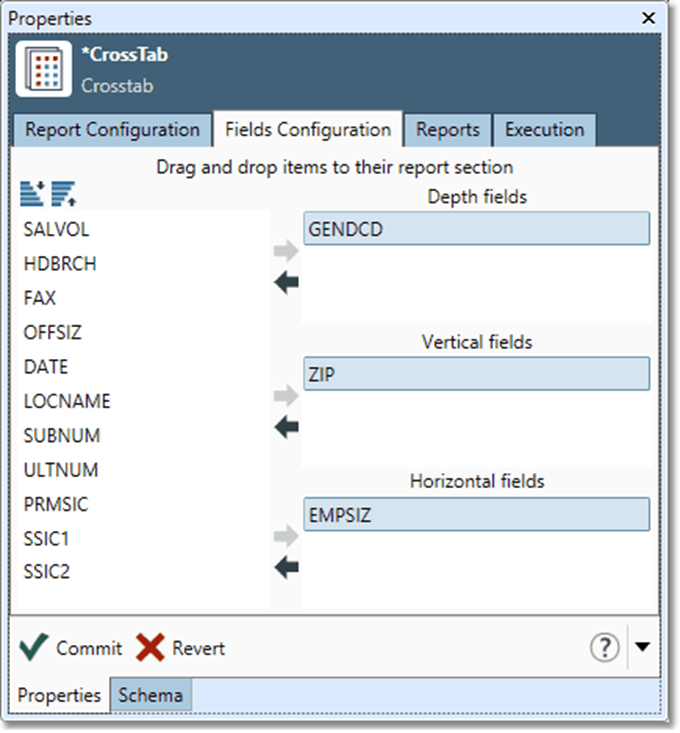
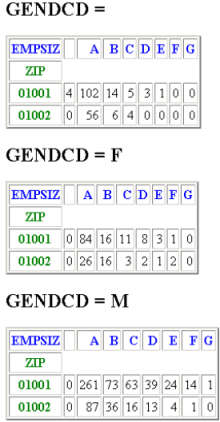
Here, ZIP is 5-digit zip code; EMPSIZ is a single-letter code in the range A-J representing the company size, or blank if unknown; and GENDCD is either M or F to represent the gender of the contact, of blank if unknown. This configuration produces the following HTML-formatted report on 1000 sample records.
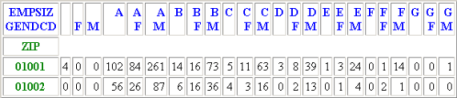
Moving GENDCD from Depth to Horizontal (making both EMPSIZ and GENDCD horizontal fields) produces a single table, shown below.
All combinations of EMPSIZE and GENDCD are enumerated.
Crosstab tool configuration parameters
The Crosstab tool has three sets of configuration parameters in addition to the standard execution options.
Report configuration
|
Parameter |
Description |
|---|---|
|
Calculation |
The calculation to be performed: Count, Percent of count, Total, Percent of total, or Average. This is optional and defaults to Count. |
|
Input field |
If you specified a Calculation of Total, Percent of total, or Average, you must specify a numeric Input field. |
|
Output scale digits |
If you specified a Calculation of Total, Percent of total, or Average, you can specify the number of decimal places to use when displaying results. This is optional and defaults to 0. |
|
Total rows |
If selected, totals the values in the rows and displays the result below the rows. |
|
Total columns |
If selected, totals the values in the columns and displays the result below the columns. |
|
Show labels |
If selected, shows the names of the columns whose values are the row and column headers. |
|
Quick report |
If selected, will generate an ad hoc report of the specified Report file name and Report format. |
|
Report file |
If you selected Quick Report, you must specify a report name and location. |
|
Report format |
If you selected Quick Report, you can select a format: CSV, Text, or HTML. Optional and defaults to CSV. |
|
Report name |
Select a previously defined report, or define a new one on the Reports tab and then select it. |
|
Outline position |
If specified, the level in the named report where the information output of this tool should be placed. The format should be one or more integers separated by decimals, for example 1.2. |
|
Header text |
Text to appear before the report section. |
|
Footer text |
Text to appear after the report section. |
Fields configuration
|
Parameter |
Description |
|---|---|
|
Depth fields |
The fields to be used to generate the "layers" of grids. |
|
Vertical fields |
The fields whose values will be displayed along the side of each grid. |
|
Horizontal fields |
The fields whose values will be displayed along the top of each grid. |
Reports
Use the Reports tab to define reports that will be available to this tool as well as other reporting tools within the project. See Defining a report.
|
Field |
Description |
|---|---|
|
Name |
Name of the report. This name will appear in the Report name list on the Report configuration tab and is entered into the repository under this name. |
|
Title |
The printed title that will appear at the top of the report. |
|
Format |
You can select a format: CSV, Text, or HTML. Optional and defaults to Text. |
|
File |
The path and file name to which the report should be written. |
|
Outline |
If specified, the outline position and level in the overall report where this section should be placed. The format should be one or more integers separated by decimals, for example 1.2. |
|
Header |
Text to appear before the report section. |
Configure the Crosstab tool
-
Select the Crosstab tool.
-
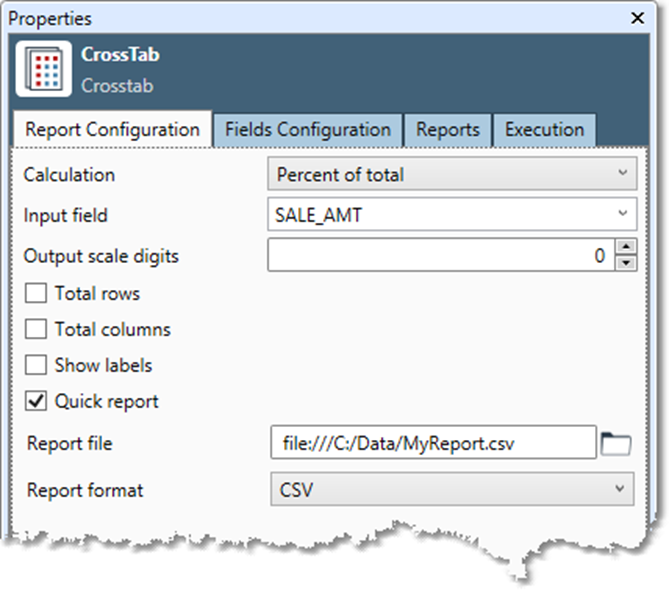
Go to the Report Configuration tab on the Properties pane.
-
Select a Calculation from the list:
-
Count: displays a count of the number of times that values for specified horizontal, vertical, and/or depth fields occur.
-
Percent of count: displays Count expressed as percent of the total records.
-
Total: displays the sum of the Input field values for the specified horizontal, vertical, and/or depth field values.
-
Percent of total: displays the sum of the Input field values for the corresponding specified horizontal, vertical, and/or depth field values, expressed as a percent of the total Input field for all records.
-
Average: displays the average of the Input field values for the specified horizontal, vertical, and/or depth field values.
-
-
If you selected Total, Percent of total, or Average, select an Input field from the list. This field must be numeric.
-
If you selected Total, Percent of total, or Average, you can optionally use the Output scale digits control to specify the number of decimal places to use when displaying results.
-
Optionally, select Total rows, Total columns, or Show labels to include the selected information in the report.
-
Choose one of these options:
-
Select Quick report and specify a Report file and Report format, and then skip to step 9.
-
Select a Report name from the list.
-
Select the Reports tab to define a new report.
-
-
Optionally, specify Outline position as one or more integers separated by decimals, for example "1.2". If there are multiple Crosstab Report or Structured Report tools in a project, this controls the order in which reports are assembled. Outline position specifies the level in the named report where the information output of this tool should be placed.
Indentation and formatting of report levels correspond to outline levels. The values of the outline level are not printed anywhere in the report. They are used solely for ordering and applying formatting.
Outline numbering need not be sequential or contiguous. You can use whatever numbers you like. We suggest initial numbering with large gaps to make it easier to insert other report sections later.
-
Optionally, enter any text you want to appear before or after the report section in the Header text and Footer text boxes.
-
Select the Fields Configuration tab.
-
Select field names and then drag and drop or select left and right arrow buttons (


-
Optionally, go to the Execution tab, and then set report options.