

Overview
The Structured Report tool lets you create reports that incorporate formatted records, organized by outline level and heading. Because it can pull many pieces of information together into a coherent whole, the tool is especially useful for creating an integrated report of a data quality assessment.
You can attach Structured Report tools to any data flow in the project. In each Structured Report tool, you define an outline level, which determines the position, style, and indentation of the formatted report section. When the project is run, each Structured Report tool generates a formatted section of a finished report. By combining multiple report tools in a project, you create one or more formatted reports, pulling together multiple pieces of information in an attractive and easy-to-read format.
Supported report formats include Text, HTML, and CSV.
Structured Report tool configuration parameters
The Structured Report tool has three sets of configuration parameters in addition to the standard execution options.
Configuration
|
Parameter |
Description |
|---|---|
|
Report name |
Select a previously defined report, or define a new one on the Reports tab and then select it. |
|
Outline position |
If specified, the level in the named report where the information output of this tool should be placed. The format should be one or more integers separated by decimals, for example 1.2. |
|
Header text |
Text to appear before the report section. |
|
Footer text |
Text to appear after the report section. |
|
Include header and footer if no records |
If selected, headers and footer will be written even if no records are processed. |
|
Presentation |
Specifies how records are presented: Column per field, Column per field + headers, Field: Value, or Wrap one field. This is optional and defaults to Column per field + headers. |
|
Max column width |
If specified, maximum width of any column, in inches. |
|
Column spacing |
If specified, spacing between columns, in inches. |
Grouping
|
Parameter |
Description |
|---|---|
|
Field |
The fields by which the report will be grouped. |
Reports
Use the Reports tab to define reports that will be available to this tool as well as other reporting tools within the project. See Defining a report.
|
Parameter |
Description |
|---|---|
|
Name |
Name of the report. This name will appear in the Report name list on the Report configuration tab and is entered into the repository under this name. |
|
Title |
The printed title that will appear at the top of the report. |
|
Format |
You can select a format: CSV, Text, or HTML. Optional and defaults to Text. |
|
File |
The path and file name to which the report should be written. |
|
Outline |
If specified, the outline position and level in the overall report where this section should be placed. The format should be one or more integers separated by decimals, for example 1.2. |
|
Header |
Text to appear before the report section. |
Configure the Structured Report tool
-
Select the Structured Report tool.
-
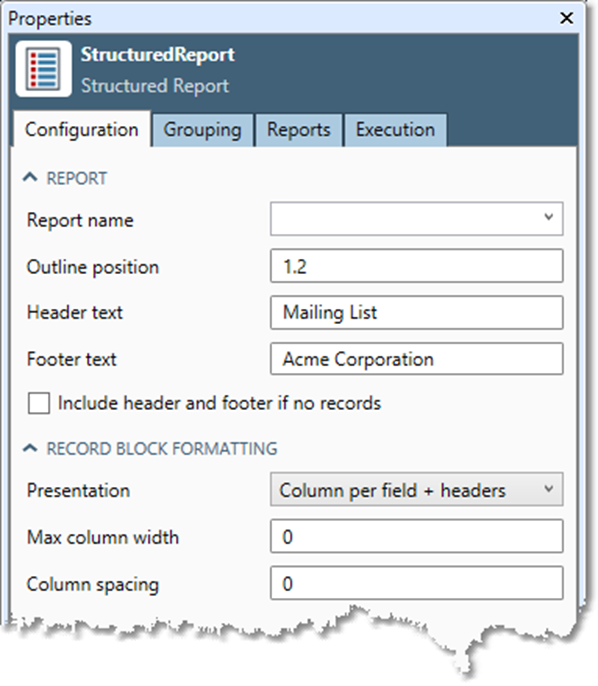
Go to the Configuration tab on the Properties pane.
-
Select a Report name from the list, or select the Reports tab to define a new report.
-
Optionally, specify Outline position as one or more integers separated by decimals, for example "1.2". If there are multiple Crosstab or Structured Report tools in a project, this controls the order in which reports are assembled. Outline position specifies the level in the named report where the information output of this tool should be placed.
Indentation and formatting of report levels correspond to outline levels. The values of the outline level are not printed anywhere in the report. They are used solely for ordering and applying formatting.
Outline numbering need not be sequential or contiguous. You can use whatever numbers you like. We suggest initial numbering with large gaps to make it easier to insert other report sections later.
-
Optionally, enter any text you want to appear before or after the report section in the Header text and Footer text boxes. If you want this information to appear even if no records are processed, select Include header and footer if no records.
-
Optionally, specify how records are presented by selecting Presentation and choosing Column per field, Column per field + headers, Field: Value, or Wrap one field.
-
Column per field: writes one column per field.
-
Column per field + headers: writes one column per field, adding column headers above the records. In a text report, the header row will be underlined using dashes.
-
Field: Value: presents records "vertically," one line per field, with the field value separated from the field name by a colon. This is useful for single-record summaries of statistics.
-
Wrap one field: used only for single-field records; it wraps the values into the number of columns specified in the Columns box, one value per column, occupying as many rows as needed.
-
-
If Presentation is specified as Field: Value or Wrap one field, you can use the Columns box to specify the number of columns to be used to display the values. If Columns is not specified, it defaults to a value of 1 for Field: Value and a variable number (depending on field size) for Wrap one field.
-
Optionally, enter a value for Max column width, the maximum width of any column (in inches).
-
Optionally, enter a value for Column spacing, the spacing between columns (in inches).
-
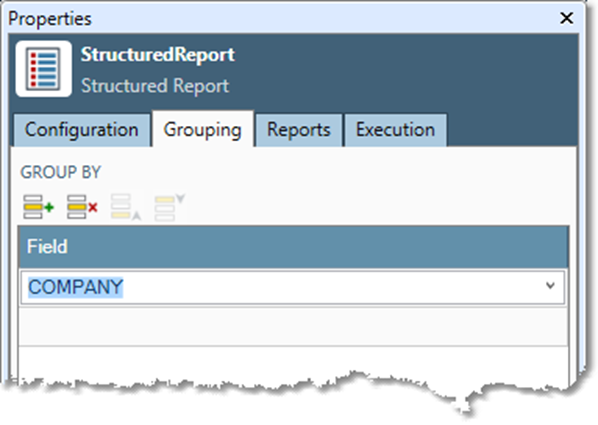
Optionally, select the Grouping tab and then select one or more Fields to organize the report. The tool will create a new report section every time the value of the selected field changes. If you select more than one field, grouping will be primarily by the field on the first row, secondarily by the second row, and so on.
-
Optionally, go to the Execution tab, and then set report options.