

Overview
An RPI chart panel can be used to visually display data in two primary ways.
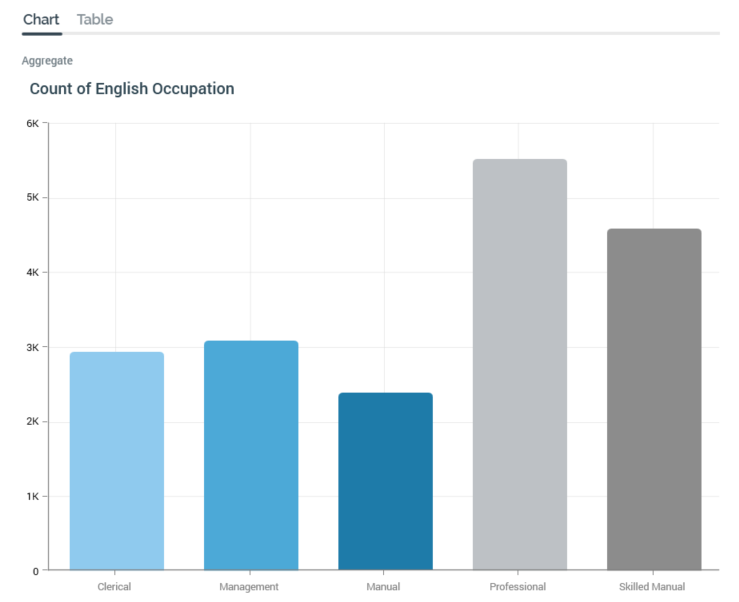
By configuring a chart with a single Attribute, you can refresh it to view a graphical representation of that attribute’s data:
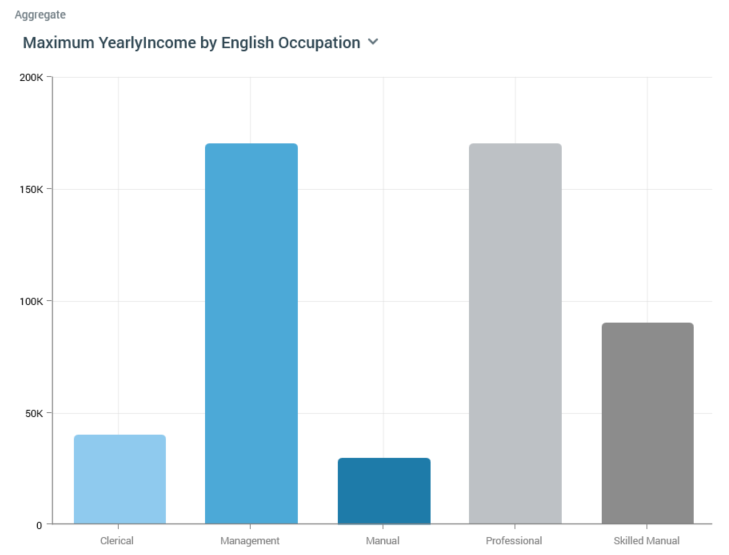
You can also configure a chart with a Function attribute. You can then select from a series of available aggregates. On refreshing the chart, you can analyze how the Function attribute is aggregated against each displayed Attribute value:
To create a new chart:
-
From the Quick Access menu, go to Audience > Rules.
-
On the Rule Designer page, select the Analysis Panel tab.
-
Choose Chart from the available options.
Resolution/Definition
A chart can be based on attributes sourced from a SQL or NoSQL database, depending on whether a resolution level or NoSQL database collection definition is selected at this property.
Any attributes used to configure the panel must be compatible with the value selected here.
Toolbox
A chart’s toolbox is shown to the left.
Its display is controlled by the Show/hide Toolbox button. It is shown automatically when a chart is created or opened.
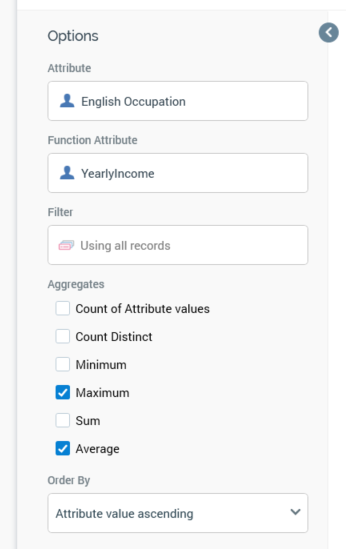
It exposes a number of Options:
-
Attribute: this property allows you to specify the base attribute to be shown in the chart. You can browse for an attribute using the recent items chooser or File System Dialog, or you can provide one using drag and drop. Once provided, you can clear the selected attribute, or invoke View Information... to view its details in the File Information dialog. An attribute must be provided prior to refreshing the chart. The property cannot be same as the Function attribute, cannot be a parameter, model project or exists in table attribute, and cannot be a function attribute configured with a constant value. The attribute selected must be sourced from the same database as the panel’s resolution level.
-
Function attribute: this optional property allows you to specify a second attribute, which can be analyzed in the context of the first Attribute, with the results being displayed in the chart. You can browse for an attribute using the recent items chooser or File System Dialog, or you can provide one using drag and drop. Once provided, you can clear the selected attribute, or invoke View Information... to view its details in the File Information dialog. The property cannot be same as the Attribute property, cannot be a parameter, model project or exists in table attribute, and cannot be a function attribute configured with a constant value. The attribute selected must be sourced from the same database as the panel’s resolution level.
-
Filter: this optional property allows you to provide a selection rule that will be executed at the point of the chart’s being refreshed, thereby limiting the data displayed therein to include just records that match the selected filter’s criteria. A Filter is initially not provided, with a message (“Using all records”) being shown instead. You can browse for a selection rule with which to configure the property, or you can provide one using drag and drop. You can also initiate the creation of a new selection rule to serve as the chart’s Filter. Once a Filter has been provided, you can open its latest version in the Rule Designer or clear it if required. Note that the resolution level of the chosen selection rule must be from the same database as the panel’s resolution level. When a Filter has been applied, it is displayed within the panel:
-
Aggregates: this property allows you to control the type of values displayed within the chart. A list of available aggregates is displayed when an Attribute or Function attribute are provided. Each is accompanied by a checkbox. If an Attribute is provided, only a single Count aggregate is available, and is checked by default. In the absence of a Function attribute, a chart can only display a simple count of Attribute values. If an Attribute and a Function attribute are provided:
-
If an integer, decimal or bigint Function attribute is provided, the following Aggregates are available:
-
Count of Attribute values: the Function attribute is ignored, and a simple count Attribute values is provided per cell.
-
Count Distinct: the number of distinct instances of the Function attribute value for each Attribute value displayed in the chart.
-
Minimum: the minimum Function attribute value for each Attribute value displayed in the chart.
-
Maximum: the maximum Function attribute value for each Attribute value displayed in the chart.
-
Sum: the sum of all Function attributes for each Attribute value displayed in the chart.
-
Average: the average of all Function attribute values for each Attribute value displayed in the chart.
-
-
If a non-numeric Function attribute of a data type other than Boolean is provided, the following Aggregates are available:
-
Count of Attribute values
-
Count Distinct
-
-
If a Boolean Function attribute is provided, only the Count aggregate is available (and is checked by default).
-
At least one aggregate must be checked prior to invocation of Refresh.
-
Order by: this dropdown property allows you to control the way in which data is ordered in the chart. The following values are available:
-
Attribute value ascending (the default)
-
Attribute value descending
-
Aggregate value ascending
-
Aggregate value descending
-
-
Using: this property is only displayed if Order by is set to one of Aggregate value ascending or descending. A dropdown field, it lists all checked aggregates, and allows you to choose a set of data by which the grid is to be ordered.
The configuration panel is read-only when a chart panel is refreshing.
Chart tab
When initially displayed, following creation or being opened, the Chart tab is blank, save for a message that states “Please configure this panel and refresh to view results”.
When a chart has been refreshed, and its results displayed, the following are shown:
-
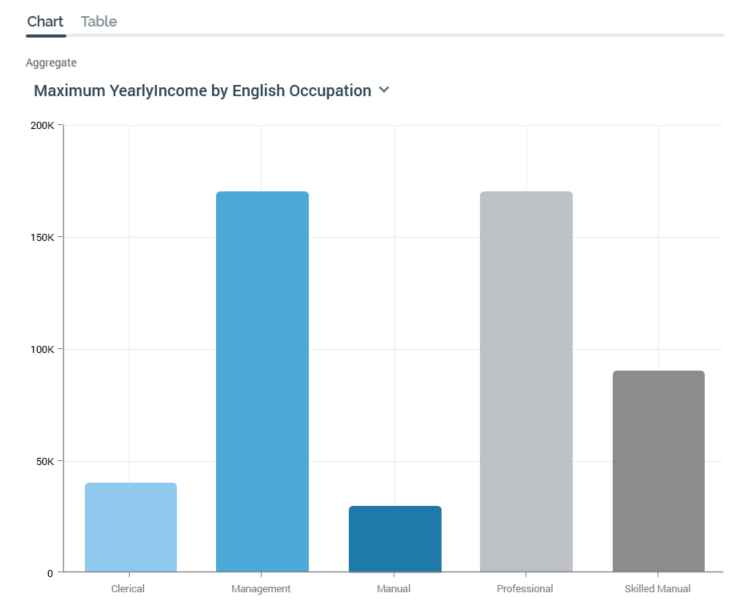
Aggregate: if no Function attribute has been selected, or if only a single aggregate was checked, this is displayed as per the following example:
If more than one Aggregate is checked, a dropdown allows you to select the aggregate you wish to view in the chart:
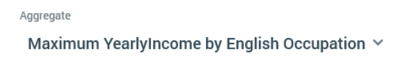
When you change the displayed aggregate, the chart is refreshed accordingly
-
Chart: results are displayed as a bar chart:
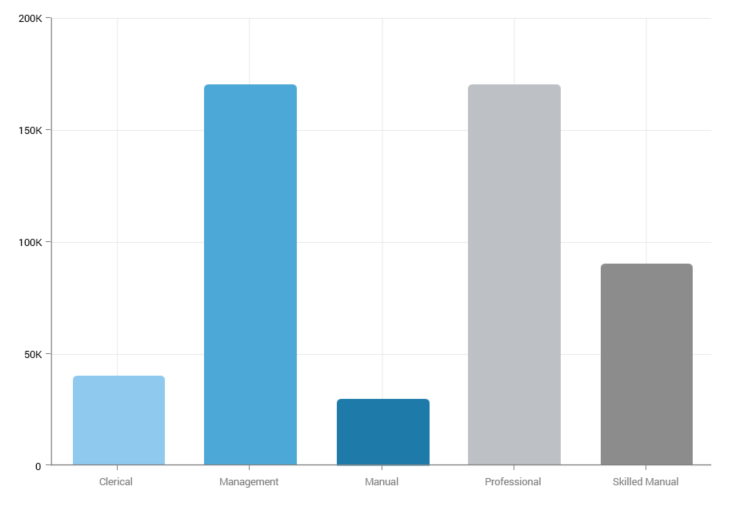
If no Function attribute was provided, or a Function attribute was provided and aggregate Count of Attribute Values was selected, the chart displays a simple count of Attribute values at the selected resolution level.
If a Function attribute was provided, and an aggregate other than Count of Attribute Values selected, the chart displays aggregated Function attribute values for each distinct Attribute value (also at the selected resolution level).
If translations have been provided for attribute values, they are rendered within a chart.
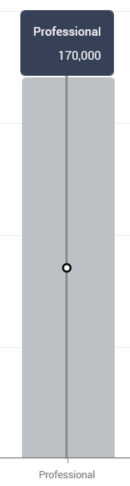
When you hover over a bar within the chart, a tooltip describes what the current context represents.
If you select a specific bar, a Create new Selection Rule from [bar name] context menu option is shown. Invocation displays a new standard selection rule in the current Rule Designer instance. Its name is “New Chart Rule” (an incrementable integer can be appended to the name to ensure its uniqueness within the current Rule Designer instance). The rule contains criteria in accordance with the bar at which Create new... was invoked.
If one or more bars are selected, and you right-click within the chart anywhere other than on a specific bar, a Create new Selection Rule from selected results context menu option is shown. Invocation also displays a new standard selection rule, within which the criteria are accordant with the currently selected bars.
When you open a chart, if results had been generated previously, the most recently-generated version thereof is displayed automatically at the panel. If the results are more than an hour old, an information icon is shown. A tooltip is shown on hovering over the same.
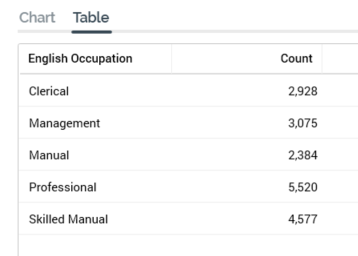
Table tab
Chart results can also be displayed in tabular form. For a simple count, the Attribute’s value and number of matching records are shown:
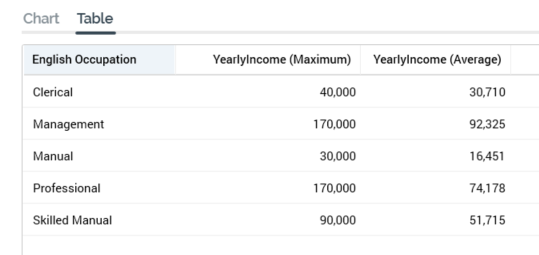
When one or more aggregates are selected, aggregated Function attribute counts in the context of the current Attribute value are displayed:
Actions menu
A chart’s Actions menu is displayed at its header. An additional option is available at a chart:
-
Copy Data to Clipboard: this option allows you to copy a chart’s tabular data to the clipboard, for later pasting into e.g. Excel.