

Overview
An RPI crosstab allows you to cross-tabulate two attributes against one another and view the resultant counts at attribute value intersections as cells within a grid:
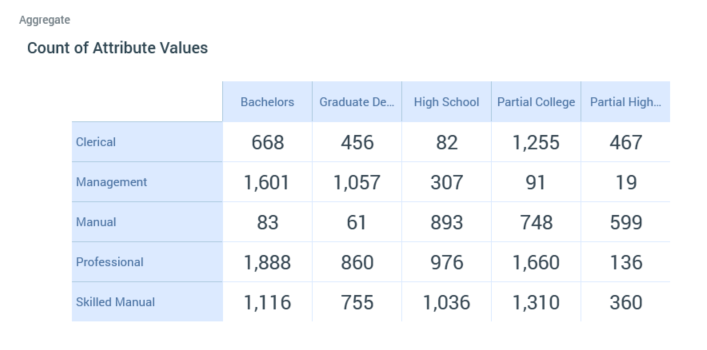
A crosstab also allows you to glean insights in respect of a third, “Function”, attribute, which can be aggregated in the context of each cell to produce a count value:
To create a new crosstab:
-
From the Quick Access menu, go to Audience > Rules.
-
On the Rule Designer page, select the Analysis Panel tab.
-
Choose Crosstab from the available options.
Resolution/Definition
A crosstab can be based on attributes sourced from a SQL or NoSQL database, depending on whether a resolution level or NoSQL database collection definition is selected at this property.
Attributes used to configure the panel must be compatible with the value selected here.
Toolbox
A crosstab’s toolbox is shown to the left.
Its display is controlled by the Show/hide Toolbox button. It is shown automatically when a chart is created or opened.
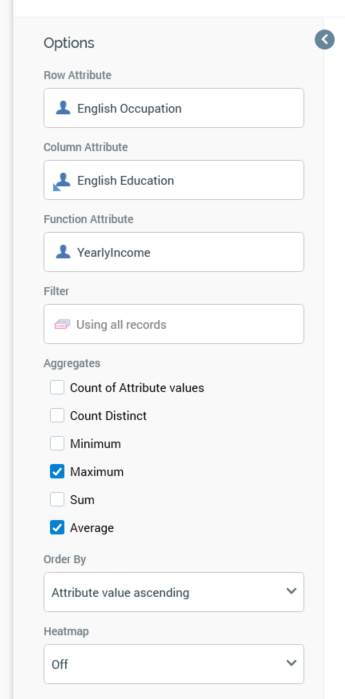
It exposes a number of Options:
-
Row attribute: this property defines the crosstab’s row attribute, values for which are displayed, one per row, to the left of the crosstab grid. You can browse for an attribute using the recent items chooser or File System Dialog, or you can provide one using drag and drop. Once provided, you can clear the selected attribute, or invoke View Information... to view its details in the File Information dialog. A Row attribute must be provided prior to refreshing the crosstab. The property cannot be same as the Column or Function attributes, cannot be a model project, exists in table or parameter attribute, and cannot be a function attribute configured with a constant value. The attribute selected must be sourced from the same database as the panel’s resolution level.
-
Column attribute: this property defines the crosstab’s column attribute, values for which are displayed, one per column, across the top of the crosstab grid. You can browse for an attribute using the recent items chooser or File System Dialog, or you can provide one using drag and drop. Once provided, you can clear the selected attribute, or invoke View Information... to view its details in the File Information dialog. A Column attribute must be provided prior to refreshing the crosstab. The property cannot be same as the Row or Function attributes, cannot be a model project, exists in table or parameter attribute, and cannot be a function attribute configured with a constant value. The attribute selected must be sourced from the same database as the panel’s resolution level.
-
Function attribute: this optional property defines an attribute that can be aggregated and analyzed in the context of cells within the crosstab results grid. You can browse for an attribute using the recent items chooser or File System Dialog, or you can provide one using drag and drop. Once provided, you can clear the selected attribute, or invoke View Information... to view its details in the File Information dialog. The property cannot be same as the Row or Column attributes, cannot be a model project, exists in table or parameter attribute, and cannot be a function attribute configured with a constant value. The attribute selected must be sourced from the same database as the panel’s resolution level.
-
Filter: this optional property allows you to provide a selection rule that will be executed at the point of the crosstab results grid’s being refreshed, thereby limiting the cell counts therein to include just records that match the selected filter’s criteria. A Filter is initially not provided, with a message (“Using all records”) being shown instead. You can browse for a selection rule with which to configure the property, or you can provide one using drag and drop. You can also initiate the creation of a new selection rule to serve as the crosstab’s Filter. Once a Filter has been provided, you can open its latest version in the Rule Designer or clear it if required. Note that the resolution level of the chosen selection rule must be from the same database as the panel’s resolution level. When a Filter has been applied, it is displayed within the panel:
-
Aggregates: this property allows you to control the type of count values displayed at cells within the crosstab grid. A list of available aggregates is displayed when a Row attribute or Row attribute and Function attribute are provided. Each is accompanied by a checkbox. If a Row attribute is provided, only a single Count aggregate is available, and is checked by default. In the absence of a Function attribute, a crosstab can only display a simple count of the intersects between Row and Column attribute values. If a Row attribute and a Function attribute are provided:
-
If an integer, decimal or bigint Function attribute is provided, the following Aggregates are available:
-
Count of Attribute values: the Function attribute is ignored, and a simple count of the intersection of attribute values is provided per cell.
-
Count Distinct: the number of distinct instances of the Function attribute value in the records that qualify in a given cell.
-
Minimum: the minimum Function attribute value per cell.
-
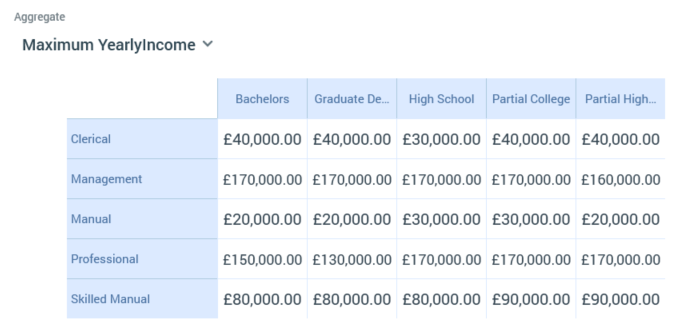
Maximum: the maximum Function attribute value per cell.
-
Sum: the sum of all Function attribute values per cell.
-
Average: the average of all Function attribute values per cell.
-
-
If a non-numeric Function attribute of a data type other than Boolean is provided, the following Aggregates are available:
-
Count of Attribute values
-
Count Distinct
-
-
If a Boolean Function attribute is provided, only the Count aggregate is available (and is checked by default).
-
At least one aggregate must be checked prior to invocation of Refresh.
-
Order by: this dropdown property allows you to control the way in which data is ordered in the crosstab grid. The following values are available:
-
Attribute value ascending (the default)
-
Attribute value descending
-
Aggregate value ascending
-
Aggregate value descending
-
-
Using: this property is only displayed if Order by is set to one of Aggregate value ascending or descending. A dropdown field, it lists all checked aggregates, and allows you to choose a set of data by which the grid is to be ordered.
-
Heatmap: you can apply a colored heatmap to crosstab results using the Heatmap property. By default, a new crosstab’s Heatmap is set to Off. You can select the property to display available heatmap options using the dropdown:
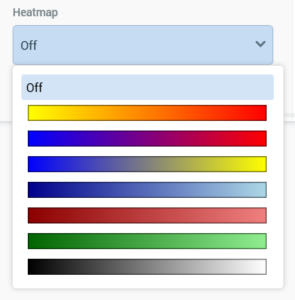
Upon selecting a heatmap color range, the selected color gradient is applied at crosstab results:
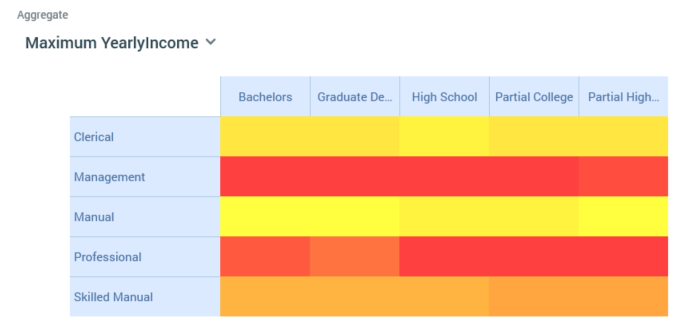
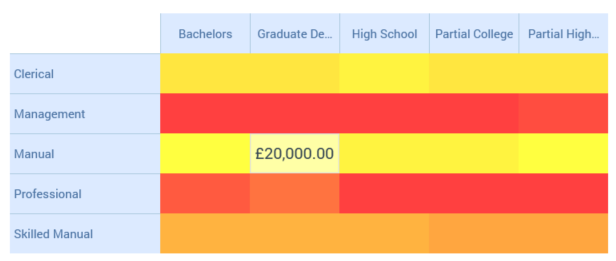
Count values are not shown when a heatmap applied, unless a cell is hovered over.
The selected Heatmap setting is persisted along with the analysis panel and applied each time results are refreshed. The lowest value takes the leftmost gradient color, and the highest value takes the rightmost gradient color. Any change to the heatmap setting is applied immediately to displayed crosstab results. Coloration is removed if the Heatmap setting is set to Off. Cells with no data are displayed in white.
The configuration panel is read-only when a crosstab panel is refreshing.
Crosstab
When initially displayed, following creation or being opened, a crosstab’s workspace is blank, save for a message:
When a crosstab has been refreshed, and its results displayed, the following are shown:
-
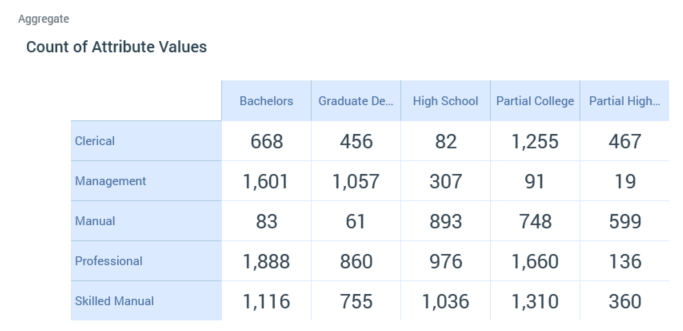
Aggregate: set to the current Aggregate’s name. If more than one aggregate was checked, you can select which to view using the dropdown provided:

-
Grid: Column attribute values are listed as headers across the top of the grid, and Row attribute values are listed to the left of the grid. Count or aggregate values are displayed at cells within grid.
If no Function attribute was provided, or a Function attribute was provided and aggregate Count of Attribute Values was selected, a cell's count represents the number of records at the selected resolution level with matching Row and Column attribute values.
If a Function attribute was provided, and an aggregate other than Count of Attribute Values selected, a cell's count represents the value of the selected aggregate for the Function attribute, in respect of records at the selected resolution within the cell in question.
A cell is selected when you hover over it. On right selecting a cell, a Create New Selection Rule from Cell option is displayed at a context menu. Invocation creates a new standard selection rule, pre-configured with criteria accordant with the cell’s Row and Column Attribute values, and displays it in the Rule Designer, after all currently-displayed rules and panels. The new rule is named ‘New Crosstab Rule’. The option is not available when the panel is popped out.
If more than 60 Row or Column Attribute values are returned, a message is displayed: ‘Results returned exceed the amount of rows and/or columns that can be shown’. Note that the non-displayed data are accessible by copying the grid’s contents to the clipboard.
When you open a crosstab, if results had been generated previously, the most recently-generated version thereof is displayed automatically at the panel.
Actions Menu
A crosstab’s Action menu is displayed at its header. An additional option is available at a crosstab:
-
Copy Data to Clipboard: this option allows you to copy a crosstab’s tabular data to the clipboard, for later pasting into e.g. Excel.