

Overview
Each widget contains two views: the configuration overlay and display mode.
Configuration overlay
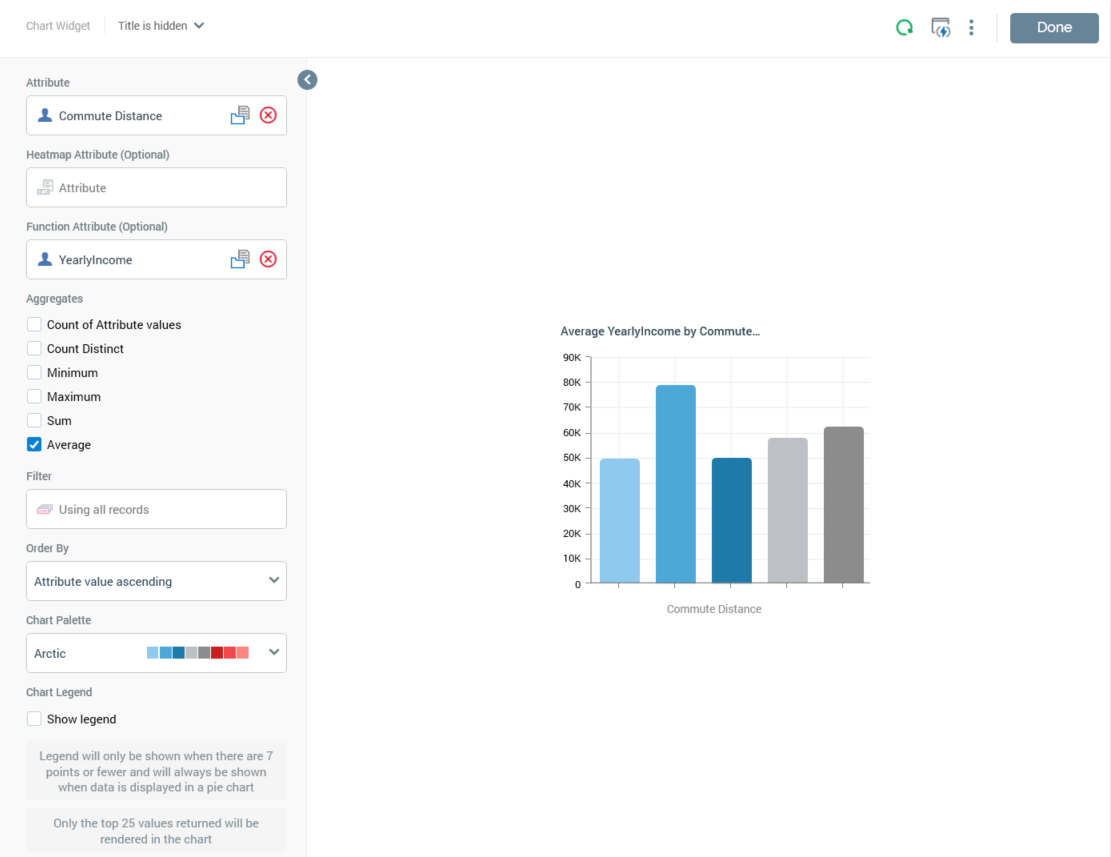
The Chart Widget configuration overlay contains the following:
Properties toolbar
-
Attribute: the main attribute to be displayed in the chart. Provision of an RPI attribute file is mandatory. You can browse for one, or supply one using drag and drop. The following attribute types are supported:
-
Database column
-
Flag
-
Function
-
Aggregation
-
Banding
-
SQL Expression
-
Once the property has been populated, you can open the attribute's file location in the File System Dialog. You can also clear your selection.
-
Heatmap Attribute (Optional): you can optionally provide another attribute to display the chart as a heatmap. The attribute provided must be different to the supplied Attribute. You can browse for a Heatmap attribute, or supply one using drag and drop. Once the property has been populated, you can open the attribute's file location in the File System Dialog. You can also clear your selection. On provision of a Heatmap attribute, the Preview image displayed in the configuration panel is updated to show a sample heatmap image. In addition, the Order by and Using properties are hidden, and the Chart palette dropdown is updated to display the available range of heatmap colors. Finally, the "Legend will only be shown..." explanatory text is removed from display at the Show chart legend checkbox.
-
Function Attribute (Optional): you can optionally provide another attribute and view aggregated counts based on the same. Population of the property and restrictions in this context are as per the Attribute property. The attribute selected must be different to the Attribute provided and must be from the same database.
-
Aggregates: this property is initially displayed when the widget's Attribute property has been populated. It allows you to select the aggregates that can be displayed in the chart. Each available attribute is accompanied by a checkbox. It is mandatory to select at least one Aggregate. The following aggregates are supported:
-
If only an Attribute is provided:
-
Count: selected by default
-
-
If an Attribute and an integer, decimal or bigint Function attribute is provided:
-
Count of Attribute values: if selected, the Function attribute is ignored, and a simple count of Attribute values displayed at the chart.
-
Count Distinct: the number of distinct instances of the Function attribute value for each Attribute value is displayed in the chart.
-
Minimum: the minimum Function attribute value for each Attribute value is displayed in the chart.
-
Maximum: the maximum Function attribute value for each Attribute value is displayed in the chart.
-
Sum: the sum of all Function attributes for each Attribute value is displayed in the chart.
-
Average: the average of all Function attribute values for each Attribute value is displayed in the chart
-
-
If an Attribute and a non-numeric Function attribute of a data type other than Boolean is provided:
-
Count of Attribute values
-
Count Distinct
-
-
If an Attribute and a Boolean Function attribute is provided:
-
Count
-
-
-
Filter: you can optionally choose a selection rule with which to filter the chart. The rule must resolve to the same database as the selected Attribute. Having populated the property, you can open the rule's latest version in the Rule Designer. You can also clear your selection.
-
Order By: this property allows you to specify the order in which data is shown in the chart. A dropdown field, it exposes the following values:
-
Attribute value ascending (the default)
-
Attribute value descending
-
Aggregate value ascending
-
Aggregate value descending
-
-
Using: this property is shown when Order by is set to one of the Aggregate... values. A dropdown field, it lists the selected aggregates, and allows you to choose the aggregate by which values in the chart will be ordered.
-
Chart Palette: this dropdown property allows you to choose the set of colors to be used when the chart is rendered. "Reverse” options are provided when a heatmap is to be shown.
-
Chart Legend: this checkbox is unchecked by default. If a Heatmap attribute has not been provided, it is accompanied by the following text: “Legend will only be shown when there are 7 points or fewer and will always be shown when data is displayed in a pie chart. Only the top 25 values returned will be rendered in the chart”.
The value cited at the second statement is set in accordance with the current value of system configuration setting AnalyzePageSize.
Preview
A preview of the widget is displayed to the top right.
Notes
-
The Chart widget is supported running in SQL and NoSQL environments.
-
You can configure a widget with an attribute exposing a column marked as PII data; however, a warning will be thrown when trying to refresh the widget.
Display mode
When a chart widget is shown in dashboard, the following are displayed:
-
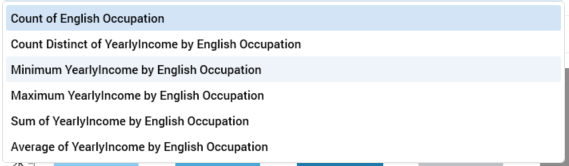
Aggregate(s): if a single aggregate was selected, its name is displayed as a read-only label. If more than one was selected, you can choose the aggregate to view using a dropdown.
-
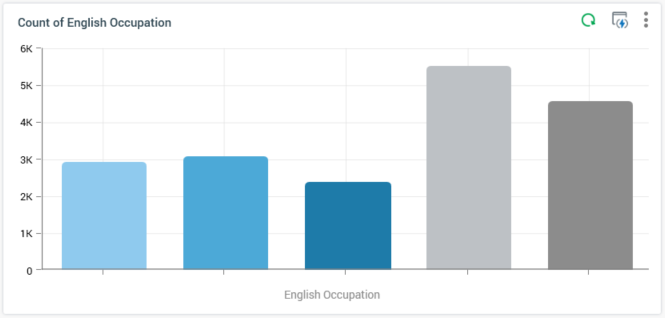
Chart: the type of chart shown depends on the widget's settings:
-
If the widget is wide or entire width, it is always shown as a bar chart.
-
If a Count or Count distinct aggregate is selected, and 7 or fewer values are displayed, the chart is rendered as a pie donut:
-
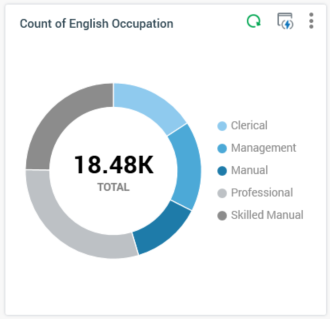
The total count of records displayed in the chart is displayed at its center. On hovering over a pie slice, a tooltip is shown.
Legend is displayed if appropriate:
If another aggregate type or more than 7 values are displayed, the chart is rendered as a bar chart:
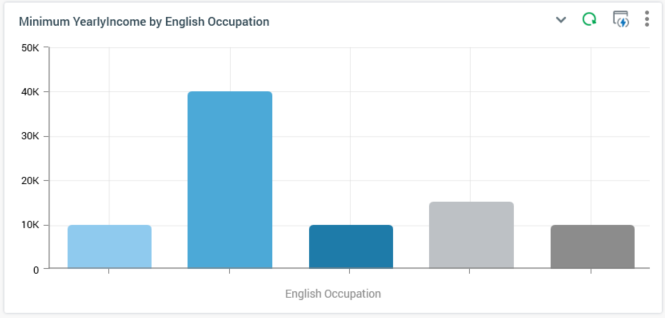
A tooltip is similarly displayed on hovering over a bar. Legend is shown if appropriate.
If a Heatmap attribute was provided, the chart is rendered accordingly:
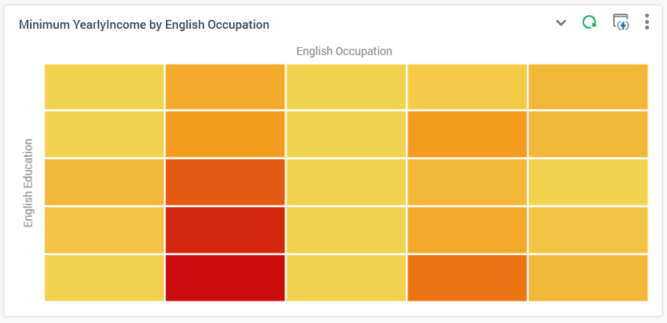
The chart's axes are ordered in ascending alphanumeric order from the top left—right and down. A maximum of 60 values can be displayed at an axis.
If translations have been provided for attribute values, they are rendered within a chart.
On hovering over a cell within the heatmap, a tooltip is shown, displaying:
-
Count of matching records
-
Left axis name and value
-
Top axis name and value
All charts' display reflects the following settings:
-
Filter
-
Order by/Using
-
Chart palette