Overview
The Database Queries tab provides visibility of database queries currently executing when workflows, system tasks and client job are run. Queries will typically only be shown for up to a minute, after which they will be removed from display.
Note that this tab is distinct from Query Trace, which offers a more persistent overview of queries executed during RPI operations. By contrast, the Database Queries tab shows only what is happening right now.

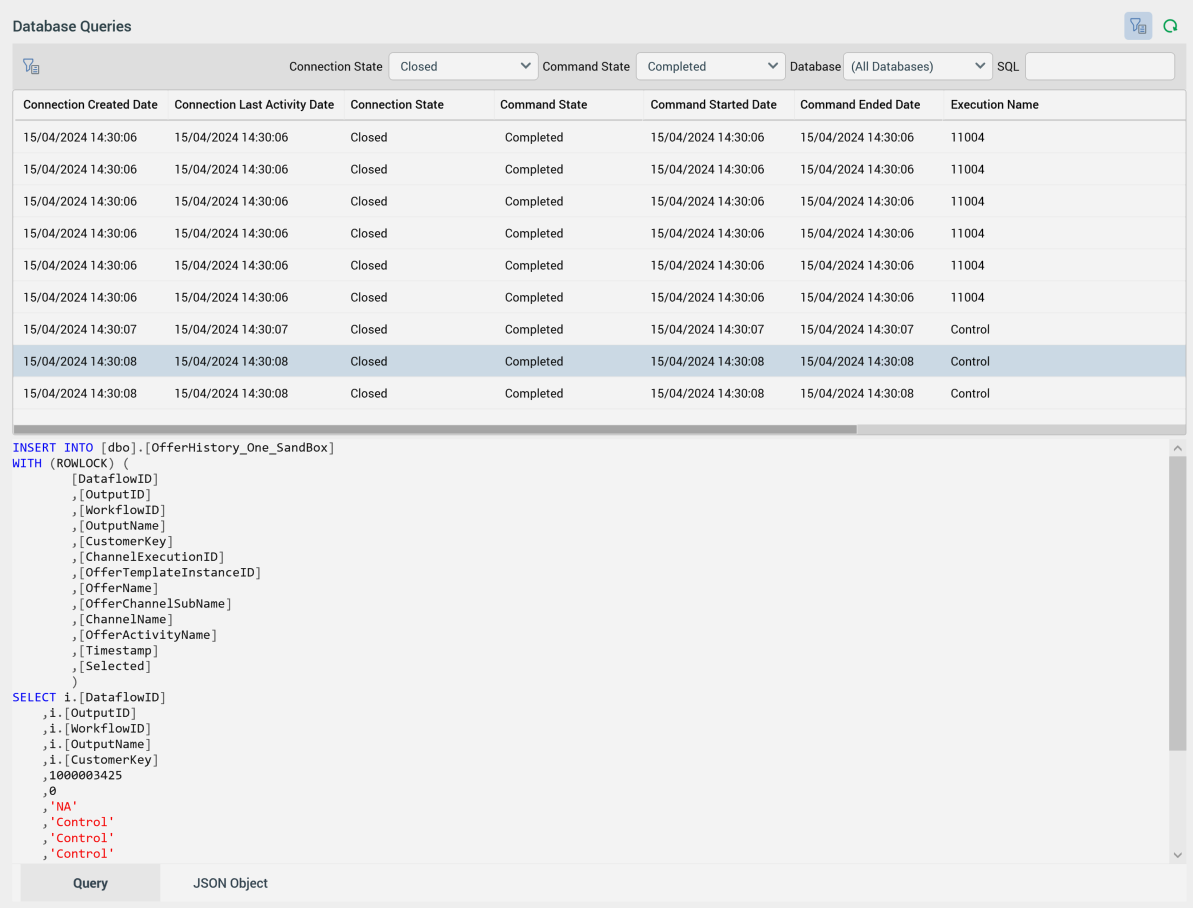
It consists of a toolbar, Database Queries grid, and selected database query details.
Toolbar
The toolbar exposes the following:

-
Show/Hide Database Query Trace Log Search Options: this toggle button controls display of the search options toolbar. It is selected by default.
-
Refresh: invocation of this option initiates search for all database queries matching the supplied search criteria. Search results are displayed in the Database Queries grid. A message is displayed when no matching records exist.
The search options toolbar exposes the following filter options:
-
Connection State
-
Command State
-
Database
-
SQL
Any specified filter options are applied at Search invocation.
Database Queries grid
The grid is populated automatically on displaying the tab for the first time, in accordance with the default search criteria.

Following execution of a search, any matching queries are listed in the Database Queries grid. If no matching entries exist, a message is displayed. Log entries are ordered by date. For each log entry, the following properties are displayed:
-
Connection Created Date
-
Connection Last Activity Date
-
Connection State
-
Command State
-
Cancel Command: this option is displayed on hover, It is protected by an ‘Are You Sure?’ dialog. It is only available when you have the Operations – Database Query Log – Cancel Command functional permission. Clicking the button sends a request to the database to cancel the command, displays an informational message, refreshes the grid and generates an audit record.
-
-
Command Started Date
-
Command Ended Date
-
Execution Name
-
File Name
-
Open Latest Version
-
-
Workflow Association ID
Note that the time for which RPI will wait before adding a Query Trace log for a long-running query is controlled by system configuration setting LongQueryTraceLimit.
Selected database query details
This section contains two tabs:
-
Query: this tab displays a formatted read-only representation of the currently-selected Query Trace log entry. You can copy the entry to the clipboard if required.
-
JSON Object: this tab displays a JSON representation of the same.
-
Error Message: shown when Command State is Failed. Details the related error.

