

Overview
In site-license mode, Data Management is a multi-user cluster of cooperating services across multiple computers. Because of the distributed nature of the system, you will often want to monitor activity across the entire site to ensure that everything runs smoothly. The Management Dashboard helps you administer your Data Management system more effectively and make the best use of your hardware resources.
In the Data Management client, choose Management from the View menu:
-
Projects & Automations displays information about all execution servers and their activities site-wide.
-
Logs affords access to logs and messages generated by Data Management activities.
-
Licensed Features lists all installed Data Management features and displays their license status.
-
Active Licenses lists the licenses currently in use.
-
Client Sessions displays the currently active users on the site.
-
Modules displays information on the state of automatic updates between the site and other computers.
-
Web Services displays detailed information about real time web-enabled Data Management projects.
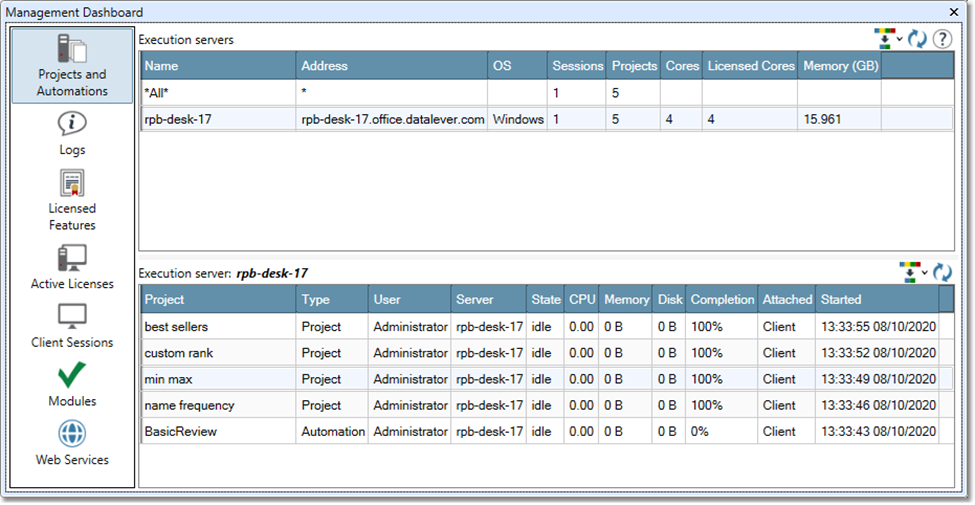
Projects & Automations
The top grid on the Projects & Automations pane lists all Execution Servers active in the site. Select a server to display all of the selected server's open projects and automations (whether running or not) in the Projects & Automations grid. Select ALL to display this information for all Execution Servers connected to the site. You can monitor projects, users, and resources. The Attached column also tells you if the project is running from the client (attached), or running in schedule or batch mode (not attached).
The client can connect to more than one Execution Server at a time. This makes it easier to manage projects running across a multi-computer system without opening a second client. When you log in using the client, you are connected to the Execution Server you choose at login time.
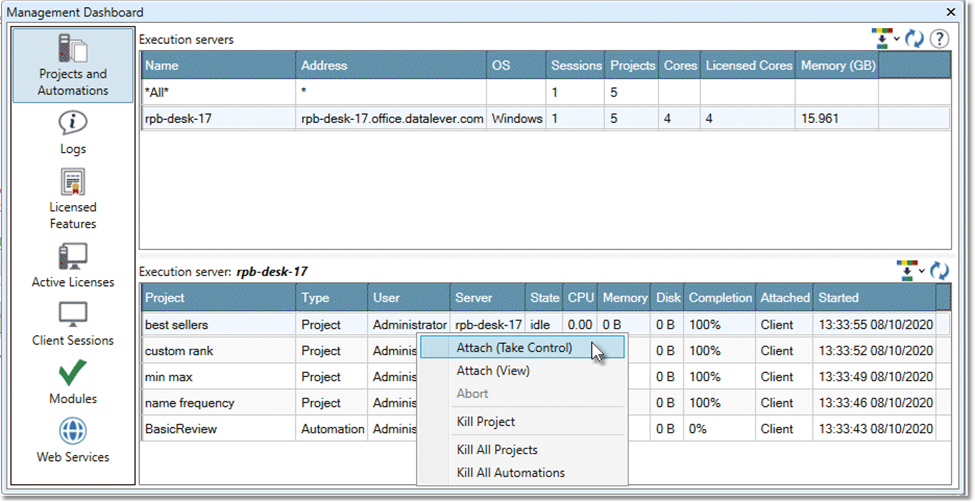
Attaching to projects
Depending on your privileges and how Site Settings are configured, you may be able to right-click a running project in the Projects grid and choose either Attach (take control) or Attach (view) from the popup menu. This creates a secondary connection to the Execution Server that "owns" the project. Taking control of a project opens it in your client and makes your session the owner of the project, giving it the same status as if you had started it yourself. If you take control of an attached project, you are effectively "stealing" control from another client! Viewing a project gives you a read-only window into a running project. If the project is attached, you can see any activity performed by the owner client.
Secondary Execution Server connections are different from your login Execution Server connection. When you open or create projects or automations, they are always on your login Execution Server. If your client disconnects from the servers, only the primary Execution Server session is saved for later reconnection.
Aborting projects
If you have Administrator privileges, you can right-click a running project in the Projects grid and choose Abort. Use caution when doing this for attached projects, because another user running the project in a client will be puzzled when it aborts.
Killing a session
If you have Administrator privileges, you can right-click a session in the Current sessions grid and choose Kill. The selected client will be logged out of the system.
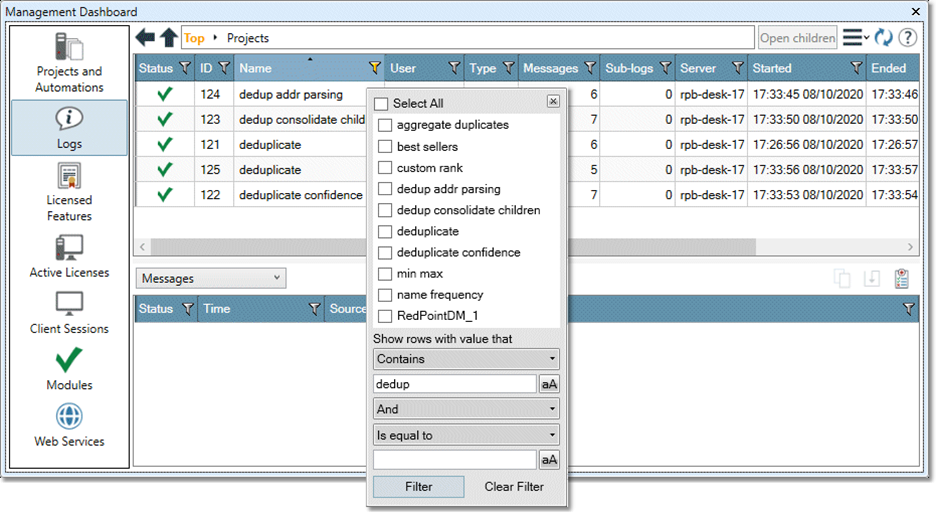
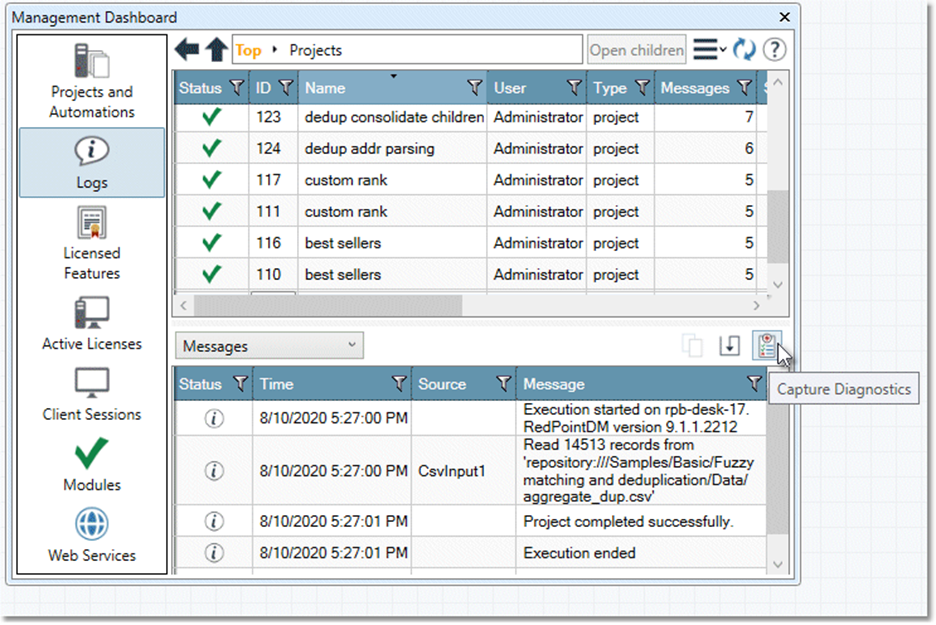
Logs
The Site Server maintains a set of logs that capture general information about Data Management's operation and specific details about project execution. The logs capture events and messages specific to the execution of projects, web services and automations, as well as steps taken to manage web services or scheduled projects. Check these logs to determine what happened during the execution of a project or automation.
-
To filter the displayed logs, select the Filter icon on the column heading of interest, and then specify the desired filter. Once you set a filter, the Filter icon turns yellow.
-
To clear a filter, select the Filter icon and then choose the Clear Filter button.
-
To sort logs, select the desired column header in the log grid.
-
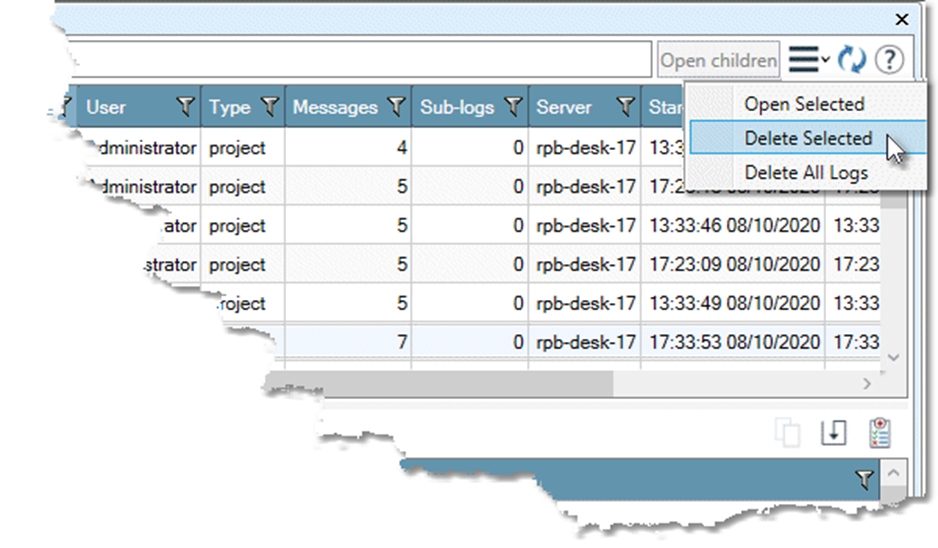
To delete logs from the log database, select the logs icon (three horizontal lines) and choose Delete Selected or Delete All Logs. Select multiple logs by pressing Shift or Ctrl while selecting with the mouse.
-
To refresh the logs, select the refresh icon.
Sub-logs
Each log can contain messages and "child" sub-logs. Logs that contain sub-logs appear in bold on the list of logs.
-
To view sub-logs, select the log Name and then choose Open children, or simply double-click the Name.
You can select log messages and then copy them to the clipboard or save them.
If you need more complete information, the Capture Diagnostics command lets you save diagnostic information about the currently-selected log into an archive.
Sub-log links in messages
Some log messages may link to an additional sub-log. For example, an automation project may run a number of data flow projects. Each of these projects will display a message in the automation’s log indicating that the project has run. These messages appear in bold, and double-clicking them or clicking Show related log goes to the relevant sub-log.
Log links in load-balanced and cluster distributed projects
Projects run on the cluster or in parallel mode can be divided into multiple parts, distributed, and run simultaneously on the cluster. A top-level log is created with links to all "child" sub-logs generated by the project parts. Sub-log names and messages indicate the partition values used in the distribution process.
Capture diagnostics
The Capture Diagnostics command lets you save diagnostic information about the currently-selected log into an archive to aid in troubleshooting with Redpoint Global Inc. support staff.
-
If the currently selected log is for a project or automation, the archive will include all objects (automations, projects, macros, data connections) necessary to reproduce the project or automation. The archive can collect all logs, crash dumps, site information, and trace files occurring during the time the log has been active. If triggered for a project log that was a child of another project or automation, the parent objects will also be captured.
-
If the currently selected log is a "top level" log (such as Web Services) or if no log is selected, no automation/project/macro objects will be collected. However logs, trace files, and core dumps occurring during the time the log has been active will be gathered.
-
In very active server environments, messages and logs may be generated at such high volumes that relevant information "ages out" before a log can be reviewed. In such cases, Redpoint Global Inc. support may work with you to configure logging and diagnostics options in Site Settings in order to capture the desired information.
-
new in 9.6.1 Starting with v9.6.1, diagnostic captures are enriched with aggregate metrics concerning data provider, tool, step, and macro usage. Collection of these metrics improves our Support outcomes by enabling Redpoint Product Management to make data-driven decisions around the Data Management product lifecycle.
To capture diagnostics
-
Select the Logs icon of the Management Dashboard, and then navigate to the log for the desired object.
-
Select the log, and then select Capture Diagnostics:
-
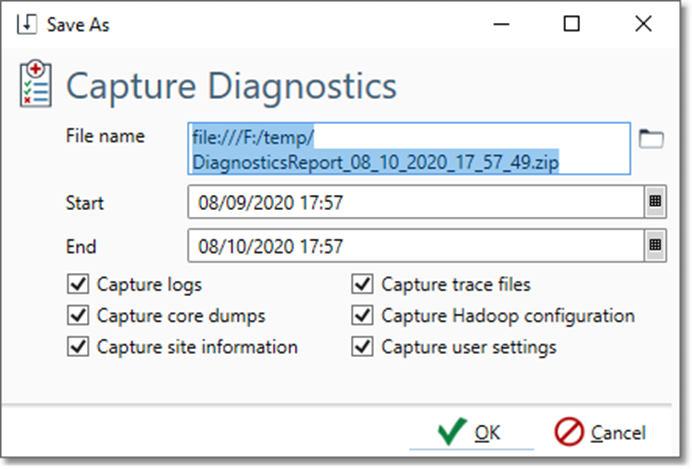
Specify a File name and location for the archive, and then configure options for the diagnostics archive file or accept the default settings (recommended).
If you selected a log for a specific project or automation, the Start and End settings will be ignored.
-
Select OK to generate the diagnostics archive file.
Licensed Features
The Licensed Features pane displays details about the site's installed modules.
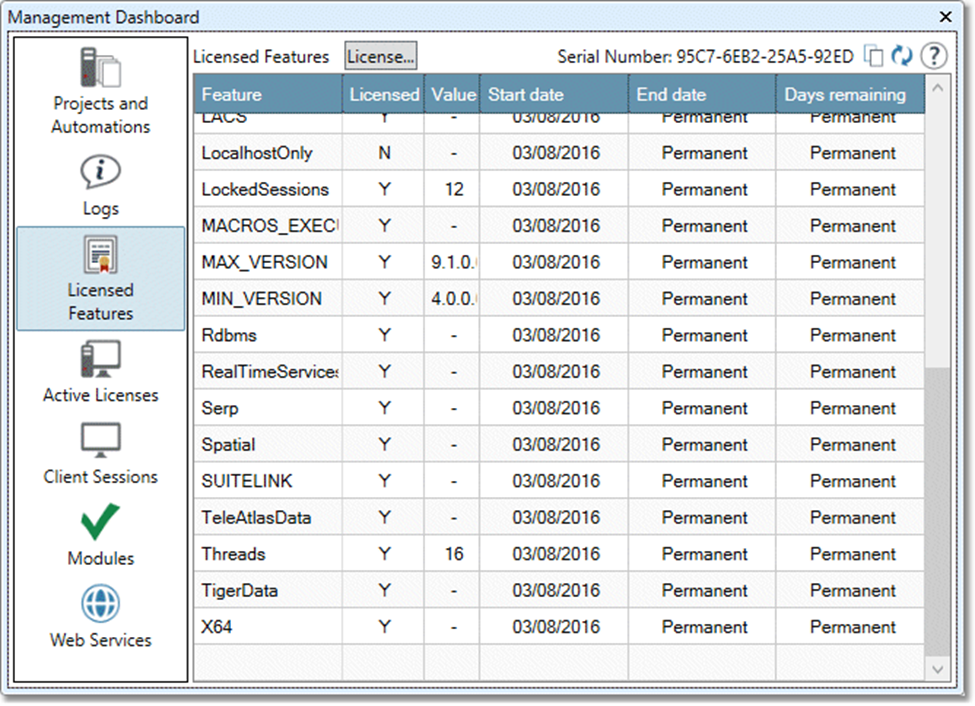
If you have received an activation code, you can select License to install or upgrade your license.
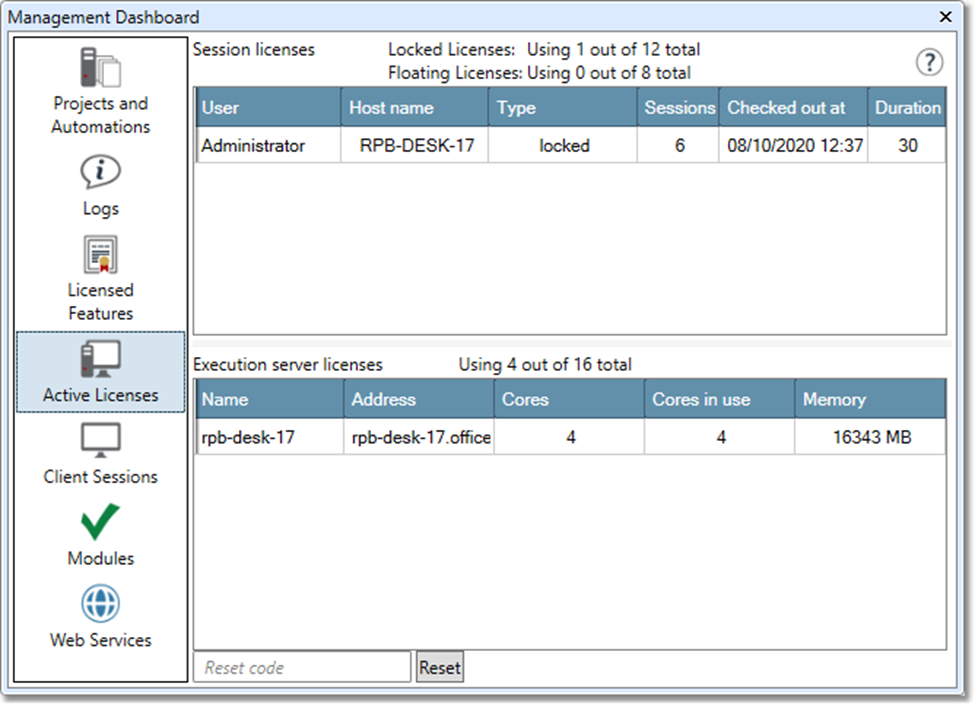
Active Licenses
The Active Licenses pane displays details about current license usage.
The Session licenses grid lists users and host names that have checked licenses out of the system. The license key can allow floating sessions, locked sessions, or both. A floating session is checked out from the server when a user logs in, and is released when the user logs out. A locked session is checked out and attached to a particular client computer for a 30-day term, after which it expires and is available for use on other computers.
The Execution server licenses grid lists the execution servers in use site-wide, as well as location and resource usage details.
Resetting the license state
You may replace or retire a client computer before the locked session license that it checked out expires. If this happens, contact Data Management support and request a license reset key. We will reply with an email containing a long string of hex digits. Copy this string, paste into the box next to the Reset button, and then select the button. This will release all locked client session licenses.
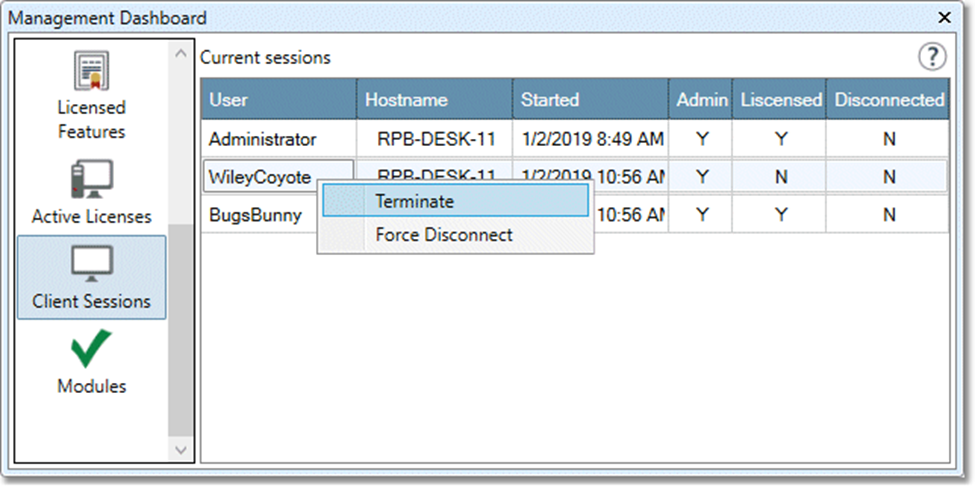
Client Sessions
The Client Sessions pane displays information about all current client sessions across the entire site. Use this to monitor users and their status.
Depending on your privileges and how Site Settings are configured, you may be able to right-click a session in the Current sessions grid and choose either Terminate or Force Disconnect from the popup menu.
-
Choose Terminate to abort all processes running under the selected session, end the session, and disconnect the session once it is ended.
-
Choose Force Disconnect to end the selected session and disconnect the session once it is ended.
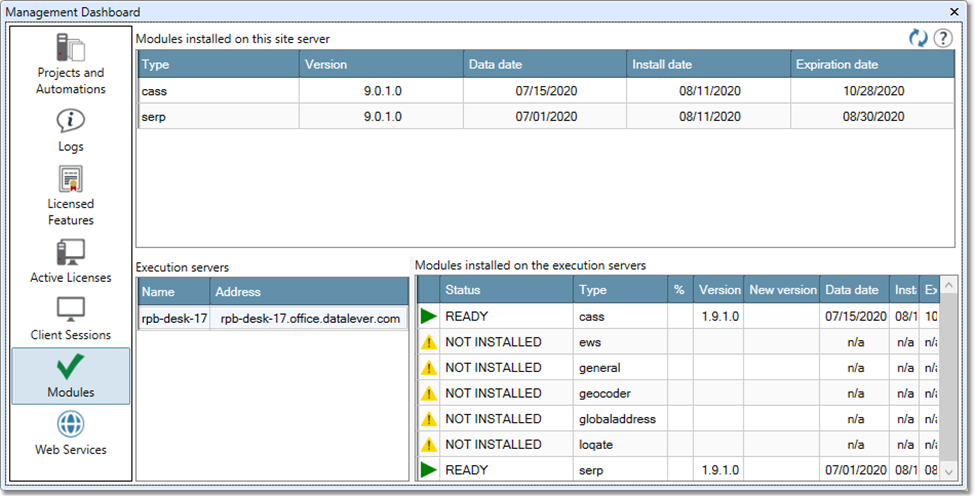
Modules
The Modules pane displays the versions of server software and software modules available on the Site Server.
Web Services
The Web Services pane displays detailed information about real time web-enabled Data Management projects. The top grid lists all web-enabled projects on the site. Select a project in the upper grid to display details about that projects' instances in the lower grid.
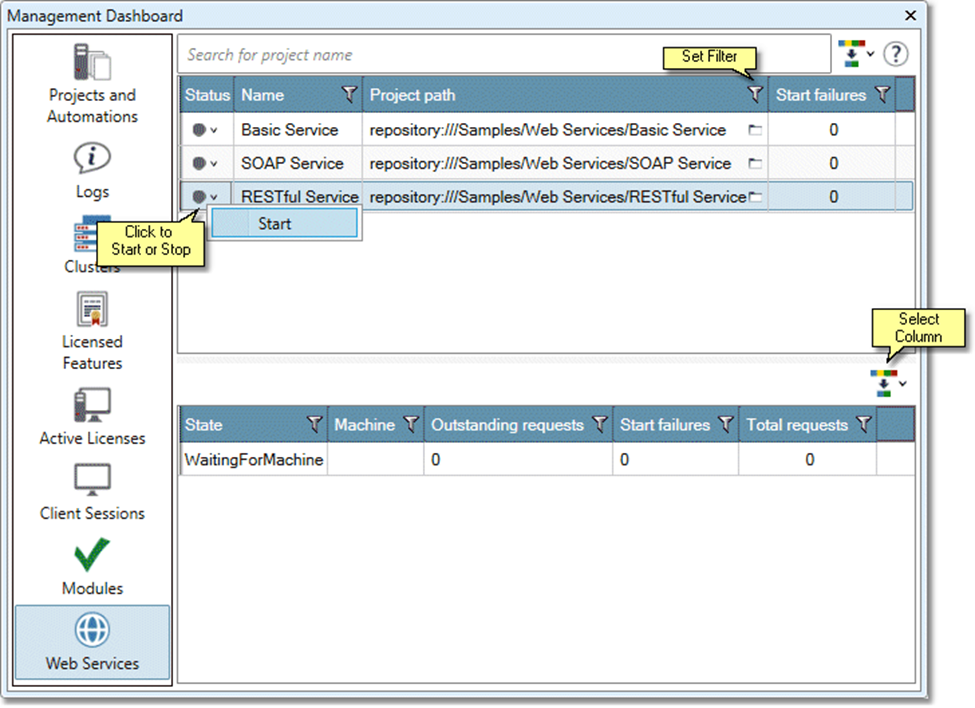
-
To specify which columns to display, select the Show/Hide Columns button. Select the Column Name box to reset all columns.
-
To stop or stop a web service, select its Status icon and then choose Start or Stop.
-
To filter the displayed information, select the Filter icon on the column heading of interest, and then specify the desired filter. Once you set a filter, the Filter icon turns yellow.
-
To clear a filter, select the Filter icon and then choose the Clear Filter button.
-
To sort a column, select the desired column header in the grid.