

Overview
The Data Management client offers an interactive environment for creating and running data transformation engines. You can use the client to monitor project execution, view data, and edit the interface parameters and layout of Data Management macros and projects. Data Management's workspace uses a configurable multi-pane layout surrounding the central project window to display a wide variety of tools and information. Use the efficient default layout shown below, or configure the workspace to suit your needs and personal preferences.
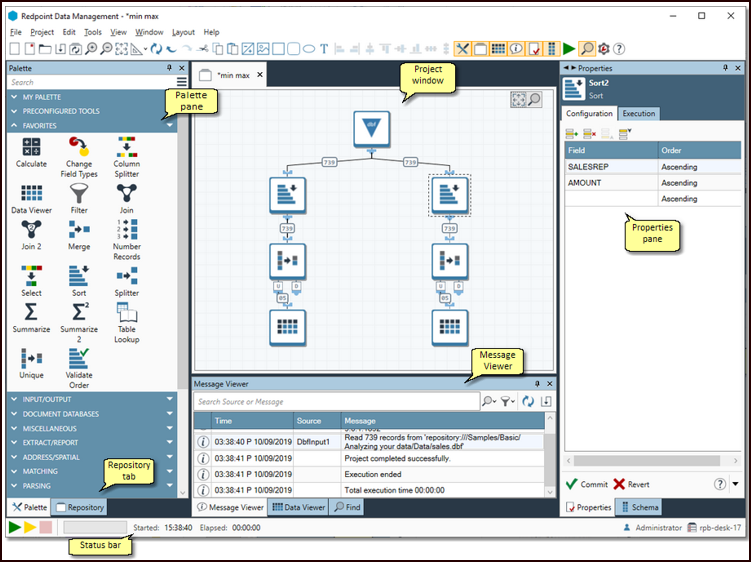
Project window
Each project that you open in Data Management appears as a tab in the main window of the Data Management client. You create projects visually by connecting tools on a canvas. When the project runs, the tools and connectors display progress information as data "flows" through them.
Repository
The repository lists Data Management objects, including Data Management projects, macros, formulas, and data objects and connections. It is similar to Windows Explorer or other file systems. You can create folders, add objects, delete objects, rename them, and move them. The repository also features version control, backup/restore, and object "packaging" capabilities. Finally, the repository lets you define and edit users and groups.
Palette
The Palette offers quick access to Data Management's data manipulation tools. To view a tool's name, position the mouse over a tool and wait a moment. The tools are also accessible from the Tools menu.
Properties
The tabbed Properties pane displays settings and information for the currently selected tool. Select the Configuration tab to view and configure tool options. Select the Execution and Reporting tab to set reporting, priority, and web service options.
Status bar
Located on the bottom edge of the Data Management workspace, the status bar is a streamlined version of the Run Control, with Run and Abort buttons as well as a display of the running time of the current project.
Message Viewer
The Message Viewer displays messages, errors, and warnings generated by the current project.
Data Viewer
The Data Viewer displays the contents of any Data View tools in your project. When you run your project, each view appears as a tab on the Data Viewer pane. To help you distinguish multiple views, you can give each Data View tool a different name, which is displayed on its tab.
Find in Project
Find in Project displays a grid showing all of the tools in the current project, along with their status and other useful details. You can navigate the project canvas by selecting tools in the grid.
Schema Viewer
The Schema Viewer shows the schema, or data structure, of the data represented by the tool or connector currently selected in an open Data Management project.
Management
The Management Dashboard is the portal to a variety of administrative information, logs, and settings. It displays an overview of all current projects and their status, as well as licenses for features, sessions, Execution Servers, and web services.
Run Control pane
You can use the Run Control pane to run your data transformation projects and monitor the job's progress.
You can also run and abort projects using the buttons on the status bar at the bottom of the workspace.
In this section: