

Batch audience
When batch audience results are displayed in the Results Window, the following are shown.
-
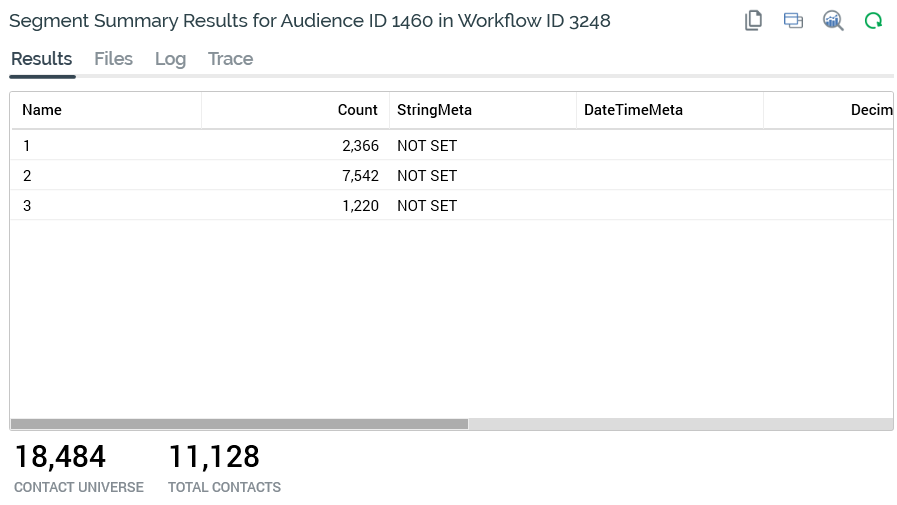
Title: the Results Window’s title is set to "Segment Summary Results for Audience Instance [x] in Workflow Instance [y]". On hovering over the title, the current Workflow Instance ID is shown in a tooltip.
Results tab
-
Toolbar:
-
Copy these details to the clipboard: copy details.
-
View Audience Instance: displays the audience instance’s details in a new tab in the Audience Instance Viewer.
-
View Insights: views insights relating to the audience in the Insights Window.
-
Refresh: refresh the results.
-
-
Grid:
-
Name: of segment.
-
Count: of records in segment.
-
Metadata attributes: showing value defined for segment for each metadata attribute defined by audience’s audience definition.
-
-
Contact universe: total number of records available when using audience’s audience definition.
-
Total contacts: the total count across all segments.
Files tab
-
Toolbar:
-
View Insights
-
Refresh
-
-
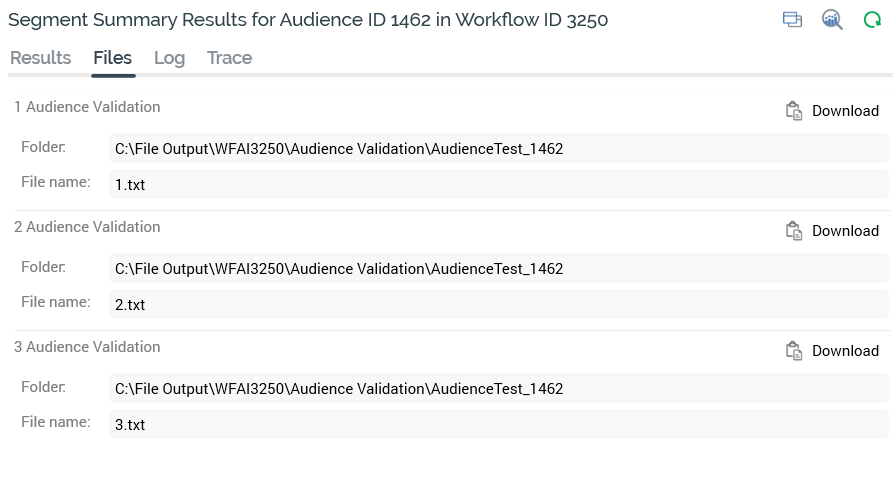
Files: if the batch audience's template's audience definition is defined as producing validation files, one validation file is produced per segment when the audience is executed, irrespective of execution mode (Test or Production).
Given this mode independence, validation files can prove very useful, as you can generate real files containing a sample of your actual segments even when running an interaction workflow in Test mode.
A validation file is named in accordance with the segment name. The file is accessible at the Results Window's Files tab and contains a number of rows in accordance with system configuration setting AudienceOutputValidationSize.
-
Log tab: toolbar as Results tab.
-
Trace tab: toolbar as Results tab.
Interactive activity
An interactive activity is only displayed in the Results Window if configured with an audience. When interactive activity results are displayed in the Results Window, the following are shown.
-
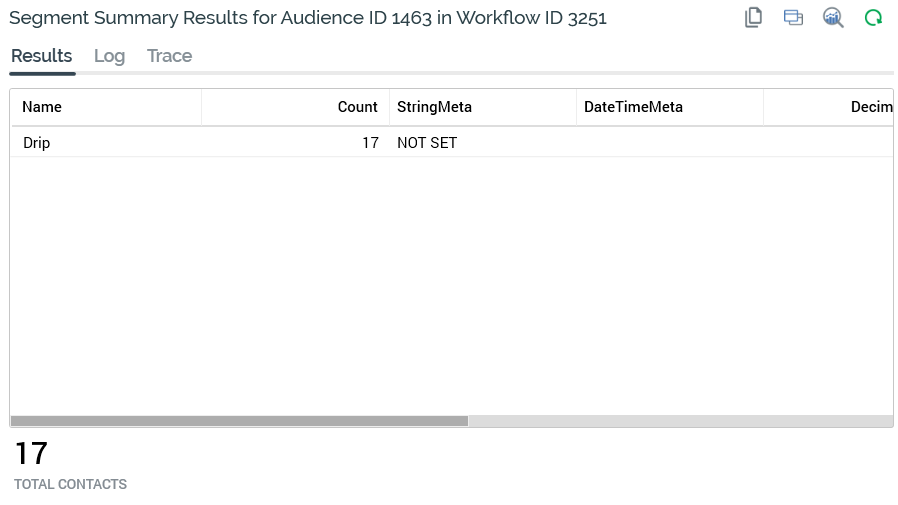
Title: the Results Window’s title is set to "Segment Summary Results for Audience Instance [x] in Workflow Instance [y]". On hovering over the title, the current Workflow Instance ID is shown in a tooltip.
Results tab
-
Toolbar:
-
Copy these details to the clipboard: copy details.
-
View Audience Instance: displays the audience instance’s details in a new tab in the Audience Instance Viewer.
-
Refresh: refresh the results.
-
-
Grid:
-
Name: of segment.
-
Count: of records in segment.
-
Metadata attributes: listing the values defined for each segment for each metadata attribute as defined by the audience’s audience definition.
-
-
Total contacts: the total count across all segments.
Log tab
The contents of the log tab depend on the current state of the interactive activity.
-
Toolbar:
-
Copy these details to the clipboard: copy details.
-
View Audience Instance: displays the audience instance’s details in a new tab in the Audience Instance Viewer.
-
Refresh: refresh the logs.
-
-
If the activity has yet to execute, the following are shown:
-
“The activity is currently waiting for the scheduled trigger”
-
“The activity will next fire at [time] on [date]”
-
-
If the activity has previously executed, the following are shown:
-
“The activity is currently waiting for the scheduled trigger”
-
“The activity last fired at [time] on [date]”
-
“The activity will next fire at [time] on [date]”
-
“The previous activity log is shown below:-[Log details]”
-
-
If the activity is currently executing, the following are shown:
-
“The activity is currently executing”
-
“The latest activity log is shown below:-[Log details]”
-
If the activity's status is Completed or Terminated, the last execution instance's log details are shown.
Trace tab
Toolbar as Results tab.
Offer activity
When offer activity results are displayed in the Results Window, the following are shown.
-
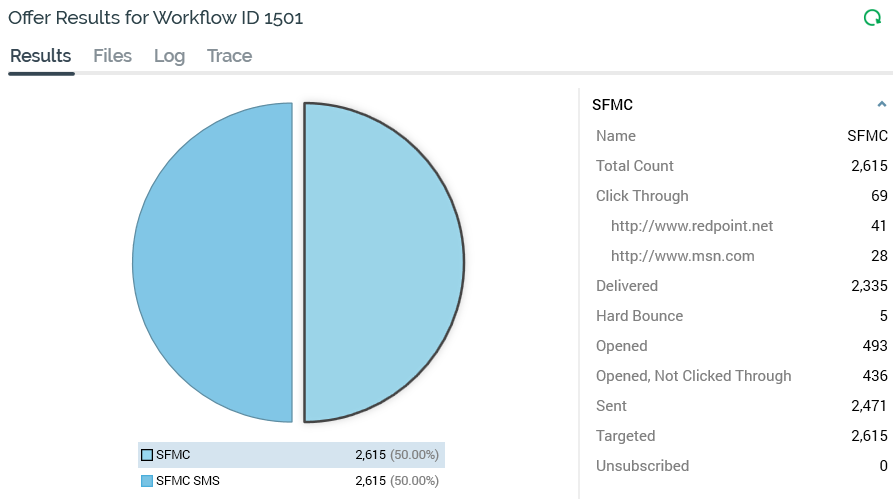
Title: the Results Window’s title is set to "Offer Results for Workflow ID [x]". On hovering over the title, the current Workflow Instance ID and Offer Execution ID are shown in a tooltip.
Results tab
-
Toolbar:
-
Copy these details to the clipboard: copy details.
-
View Dynamic Content Results: this button is only available when an email or SMS channel is selected. Invocation displays the Dynamic Content Results dialog.
-
Refresh: refresh the results.
-
-
Channel breakdown: this section is shown to the left, only when a multichannel offer’s results are being viewed. A proportional representation of the offer’s channel mix is shown in a pie chart. You can hover over the pie chart to view a tooltip containing the channel name, count and percentage. A legend is displayed below the pie chart.
For each channel, a color indicator, the channel name, count and percentage of the offer total are displayed. You can select a channel by selecting on a pie slice or legend entry. Doing so populates additional results details, which are shown to the right. -
Additional results: shown to the left of the offer Results tab when a single channel offer’s results are being viewed, and to the right of the channel breakdown pie chart when a multichannel offer is selected, this section is populated with all relevant additional results.Each set of results—for example, as provided by a channel, or by a web analytics adapter—is contained within a category heading. Headings are displayed in alphabetical order. You can double-click a heading to roll it up or expand it as required.
Each category contains channel-specific results. Each result’s name and value are displayed.
The following categories and results are displayed in accordance with their relevance to the currently-selected channel:-
Data Extract:
-
Targeted
-
-
Outbound Delivery:
-
Targeted
-
Delivery states as defined at the channel (if configured)
-
All changes of state associated with outbound delivery offer execution are persisted in the offer history states data warehouse table.
-
-
-
Realtime Cache:
-
Targeted
-
-
Acoustic email:
-
Click Through
-
Duplicates
-
Hard Bounce
-
Opened
-
Opened, Not Clicked Through
-
Not Opened
-
Opted Out
-
Sent
-
Soft Bounce
-
Targeted
-
Reply Abuse (contacts who complained through their ISP)
-
Reply Change Address (replies from contacts requesting an email address change. Tracked but not acted upon)
-
Reply Mail Block (messages blocked by an ISP)
-
Reply Mail Restriction (the number of mail restriction replies for contacts of the domain)
-
Reply Other (reply categorized as something other than one of the following: out of office reply, opt out request, abuse complaint, or change of address request)
-
Suppressed
-
Specific Link Clicks: please see Salesforce Marketing Cloud email for further information.
-
-
Cheetah Digital email:
-
Sent
-
Opened
-
Hard Bounce
-
Soft Bounce
-
Click Through
-
Unsubscribed
-
Not Opened
-
Opened, Not Clicked Through
-
Delivered
-
Invalid Addresses
-
Specific Link Clicks
-
-
Eloqua email:
-
Targeted
-
Sent
-
Opened
-
Click Through
-
Bounced
-
Unsubscribed
-
Not Opened
-
Opened, Not Clicked Through
-
-
LuxSci email:
-
Sent
-
Click Through
-
Specific Link Clicks
-
Spam
-
Message was marked as spam by a recipient.
-
-
Anonymous Spam
-
Count of Spam complaints in which the ISP of the recipient does not publish who is complaining.
-
-
In Queue
-
Currently in queue trying to be or waiting to be delivered.
-
-
Soft Bounce
-
Hard Fail
-
The message was accepted by the recipient servers successfully, but LuxSci later received a bounce back email containing a hard failure delivery status (e.g. user does not exist).
-
-
Delivered
-
Failed
-
Permanently failed to be delivered
-
-
Targeted
-
Not Opened
-
Opened, Not Clicked Through
-
Machine Opens
-
One or more machine names listed as sub-states along with aggregated counts
-
-
-
Salesforce Marketing Cloud (SFMC) email. SFMC results are available at the provider for up to 180 days.
-
Click Through
-
Delivered (Sent – Bounces)
-
Duplicates
-
Forwarded
-
Hard Bounce
-
Invalid Addresses
-
Opened
-
Opened, Not Clicked Through
-
Not Opened
-
Other Bounce
-
Sent
-
Specific Link Clicks
-
A list of the link URLs selected within received emails is displayed, along with the count of unique recipients who selected the same at each. URLs are listed in descending link-click count order, and up to a maximum of 100 links can be presented in this context.
-
-
Soft Bounce
-
Targeted
-
Total Errors
-
Unsubscribed
-
SFMC Existing Unsubscribes
-
SFMC Existing Undeliverables
-
Forward to Social
-
Facebook
-
Twitter
-
-
-
SFMC Data Transfer:
-
As SFMC email
-
-
SendGrid email:
-
Bounced
-
Note that the SendGrid email server rejects email due to seemingly temporary conditions, such as a full inbox or bad email address.
-
-
Soft Bounce
-
Bounced/blocked; recipient will not be suppressed.
-
-
Deferred
-
Delivered
-
Dropped
-
Duplicates
-
Opened
-
A
Truevalue in theSgMachineOpencolumn within theSendGridEventsdata warehouse table indicates that an "Open" event was caused by a machine;Falseindicates the event was initiated by a human.
-
-
Opened, Not Clicked Through
-
Not Opened
-
Processed
-
Targeted
-
Unsubscribed
-
Click Through
-
Reported As Spam
-
Invalid Addresses
-
Invalid Sender Addresses
-
Specific Link Clicks
-
Please see SFMC email for further information.
-
-
-
Twilio SMS:
-
Duplicates
-
Targeted
-
Queued
-
Sending
-
Sent
-
Delivered
-
Undelivered
-
Failed
-
Stop
-
Stop All
-
Unsubscribe
-
Cancel
-
End
-
Quit
-
Opt-Out
-
Sum of Stop, Stop All, Unsubscribe, Cancel, End, and Quit.
-
-
Start
-
Yes
-
Revoke
-
Custom Survey Response
-
Only displayed if the offer channel's Enable survey responses field was checked. The count of how many unique survey respondents replied with a specific response, as defined by the offer's Primary and Additional keywords, is shown for each such response.
-
-
Help
-
Count of inbound messages with body "HELP" sent to the Twilio number.
-
-
Info
-
Count of inbound messages with body "INFO" sent to the Twilio number.
-
-
Invalid Numbers
-
The OfferHistory_States table's Event.
-
Name column is populated for Failed and Undelivered results with "<Error Code> : <Error Message>" (as supplied by Twilio), to a maximum of 255 characters.
-
-
-
mPulse SMS:
-
Targeted
-
Sent
-
Send Failure
-
-
Google Ads Customer Match data onboarding:
-
Received
-
The number of targets received by Google Ads
-
-
Invalid entries
-
The number of targets tagged by Google Ads as invalid entries.
-
-
Targeted
-
-
LiveRamp
-
Targeted
-
-
Salesforce.com:
-
Invalid Leads
-
Processed
-
Targeted
-
Total Errors
-
Uploaded
-
-
Airship Push Direct
-
Sends (the number of pushes sent)
-
Direct (the number of direct responses to the notification)
-
Targeted
-
-
Google Firebase Direct
-
Sent
-
Failed
-
In addition, results in the following categories are displayed if appropriate.
-
-
-
Custom state flows
-
Web analytics adapters:
-
Google analytics adapters: shown for channels associated with a Google Analytics adapter. Each Google Analytics metric, as defined at the web analytics adapter, is shown, along with its result. In addition, three additional metrics are provided for each goal defined at the web analytics provider.
-
[GoalName] starts: this metric represents the number of website visitors attracted by the email offer who commenced the sales funnel.
-
[GoalName] completions: this metric represents the number of website visitors attracted by the email offer who completed the sales funnel.
-
[GoalName] value: a pecuniary amount, calculated as the number of completions x a (sale) value configured at the website.
-
Google Analytics results are aggregated and anonymized…it is not possible to target further communications to specific individuals counted within Google Analytics results.
-
-
Web Events adapters: results are collated for all web events adapters attached to a given channel. The results consist of standard web events state results, and custom web events metric and state results. The following standard web events states are available:
-
Page Visit
-
Form Submission
-
Link Click: a page visitor selected on a link in the web page to which directed by an offer URL.
Custom metric results are used to show transactional values—e.g. Total Sales Amount. These are cumulative across website visitors and sessions. You can only utilize a website-provided parameter for a metric if it returns transactional data. Custom state results are used to count individuals undertaking an action at website—e.g. Made a Purchase. These are counted on an individual website visitor basis. You can respond to individual's assuming a given state in a downstream activity—for example, you might want to send an email upon a visitor’s requesting information. You can use website-provided parameter for a state irrespective of whether it returns transactional data. In both cases, results are sourced from all Web Events adapters associated with the channel.
-
-
-
Availability of additional results is not necessarily immediate, being subject to delay while waiting for provision of data from external providers, and also update by the RPI Execution service. In particular, it can take several hours for Google Analytics results to be made available.
Files tab
This provides access to any files generated if the offer supported a data extract channel, and/or if one or more audit files was/were generated. The toolbar is as the Results tab.
Log tab
Toolbar contains:
-
Copy these details to the clipboard
-
View Dynamic Content Results
-
Refresh
-
Trace tab
Toolbar as Log tab.
Decision Offer activity
Following Production decision offer activity execution, and determination of a winning offer, the following are shown:
-
Title: the Results Window’s title is set to ‘Winning Offer Results for Workflow ID [x]". On hovering over the title, the current Workflow Instance ID and Offer Execution ID are shown in a tooltip.
Results tab
Containing a toolbar and State Results section.
-
Toolbar contains:
-
Refresh: refresh the results.
-
State Results section: displays state results relevant to fulfillment undertaken by the decision offer activity are displayed.
-
Test Offer Results: this section contains a grid containing the following read-only columns:
-
Winner
-
Indicated by tick
-
-
Offer
-
Targeted Count
-
[State] Count
-
Percentage
-
-
If the default offer was selected, due to no winning offer being determined, results shown are as described above.
If an offer was chosen arbitrarily (due to no winning offer being determined and no default offer having been defined, or decision offer execution having occurred prior to availability of the results upon which the decision was to be made), results are also shown as above.
If the decision offer activity was executed in Test mode, a message (“No information to display, as run in test mode") is shown instead of results details.
Files tab
This provides access to any files generated by the decision offer activity.
-
Toolbar:
-
Refresh
-
Log tab
-
Toolbar:
-
Copy these details to the clipboard
-
Refresh
-
Details of the offer fulfilled by the decision offer activity may be found in the Log tab. If a default or arbitrary offer was fulfilled, this fact also appears in the Log.
Trace Log tab
Toolbar as Log tab.
Export activity
When export results are displayed in the Results Window, the following are shown.
-
Title: the Results Window’s title is set to "Export Results for Workflow ID [x]". On hovering over the title, the current Workflow Instance ID and Offer Execution ID are shown in a tooltip.
Results tab
-
Toolbar:
-
Copy these details to the clipboard
-
Refresh
-
-
Export results are shown below the toolbar.
Files tab
This provides access to any files generated by the export.
-
Toolbar:
-
Refresh
-
Log tab
-
Toolbar:
-
Copy these details to the clipboard
-
Refresh
-
Trace tab
Toolbar as Log tab.
Queue activity
When queue activity results are displayed in the Results Window, the following are shown.
-
Title: the Results Window’s title is set to "[Activity Type] Results for Workflow ID [x]".
-
Results tab: containing a toolbar and channel results.
-
Toolbar contains:
-
Refresh: fresh the results.
-
Channel Results: results for the current offer’s channel are displayed. A pie chart is used to display the breakdown between the successful offer execution count, and any errors that may have occurred when processing records received from the listener queue. All results are shown for one Test and one Production instance. The activity’s Duration reflects its most recent period of activation.
-
-
-
Files tab
-
Log tab: log entries are available for the most recent execution of the queue activity.
Broadcast
When broadcast results are displayed in the Results Window, the following are shown.
-
Title: the Results Window’s title is set to "Broadcast Results for Workflow ID [x]".
-
Results tab:
-
Toolbar:
-
Refresh
-
-
Channels treeview
-
Shown to the left and above the channel results bar chart. The treeview lists all channels through which the broadcast was executed. You can highlight a channel to view its results, which are displayed in the Channel results bar chart below the treeview. Additional results are also shown to the right.
-
-
Channel results
Azure Notification
Each number represents the number of subscribed app users by platform:
-
Android
-
iOS
-
Windows Phone
-
Provision of broadcast results may not be instantaneous, depending on the timeliness of the Task Manager service’s execution of the relevant channel synchronization task.
-
Log tab
-
Toolbar contains:
-
Copy these details to the clipboard
-
Refresh
-
-
Google Firebase
Sent.
Control activity
When control results are displayed in the Results Window, the following are shown.
-
Title: the Results Window’s title is set to "Control results for Workflow ID [x]". On hovering over the title, the current Workflow Instance ID and Offer Execution ID are shown in a tooltip.
-
Results tab: containing a toolbar and a grid.
-
Toolbar:
-
Copy these details to the clipboard
-
Refresh
-
-
Grid:
-
[Untitled]: "Records targeted".
-
Count: of records targeted.
-
-
Custom state flow counts are also provided (if appropriate).
-
Files tab: displayed if the control’s execution resulted in the creation of an audit file.
-
Log tab: toolbar as Results tab.
-
Trace tab: toolbar as Results tab.
Subscription group
When subscription group results are displayed in the Results Window, the following are shown.
-
Title: the Results Window’s title is set to "Subscription Group Results for Workflow ID [x]".
-
Results tab:
-
Toolbar:
-
Refresh
-
-
Channels treeview
-
Shown to the left and above the channel results bar chart. The treeview contains a single entry (currently only Alchemer is supported). On highlighting a subscription group, you can view related results in the channel results bar chart, displayed below the treeview, and in the additional details section shown to the right.
-
-
Channel results
-
A bar chart, shown below the channels treeview. Selecting on a bar also highlights its accompanying legend. Similarly, the bar is selected when you select on the matching legend.
-
Additional results: these are shown to the right. The results are the same as shown within the channel results bar chart.
-
-
-
The following results are available at an Alchemer subscription group:
-
Total Respondents
-
Log tab
-
Toolbar:
-
Copy these details to the clipboard
-
Refresh
-
-
Data process activity
When data process activity results are displayed in the Results Window, the following are shown.
-
Title: the Results Window’s title is set to "Data Process Results for Workflow ID [x]".
-
Results tab
-
Toolbar:
-
Copy these details to the clipboard
-
Refresh
-
-
Grid:
-
Displays the count of Records processed by the Redpoint Data Management project.
-
-
-
Log tab
-
Toolbar:
-
Copy these details to the clipboard
-
Refresh
-
-
-
Trace tab
-
Toolbar:
-
Copy the Trace Log details to the clipboard
-
Refresh
-
-
Data transfer activity
When data transfer activity results are displayed in the Results Window, the following are shown.
-
Title: the Results Window’s title is set to "Data Transfer Results for Workflow ID [x]".
-
Results tab
-
Toolbar:
-
Copy these details to the clipboard
-
Refresh
-
-
Grid:
-
Displays the count of Records targeted by the activity.
-
-
-
Files tab: providing the ability to access any files generated by execution of the offer with which the activity is configured.
-
Log tab:
-
Toolbar:
-
Copy these details to the clipboard
-
Refresh
-
-
-
Trace tab
-
Toolbar:
-
Copy the Trace Log details to the clipboard
-
Refresh
-
-