

Overview
The activity details panel is shown to the right of the activities list. It contains the following:
-
Title
-
Toolbar
-
Tab set
-
Results
-
Files
-
Log
-
Trace
-
Toolbar
The activity details panel contains a toolbar, which is shown above the tab set. The contents of the toolbar depend upon the activity selected and tab selected.
Tab set
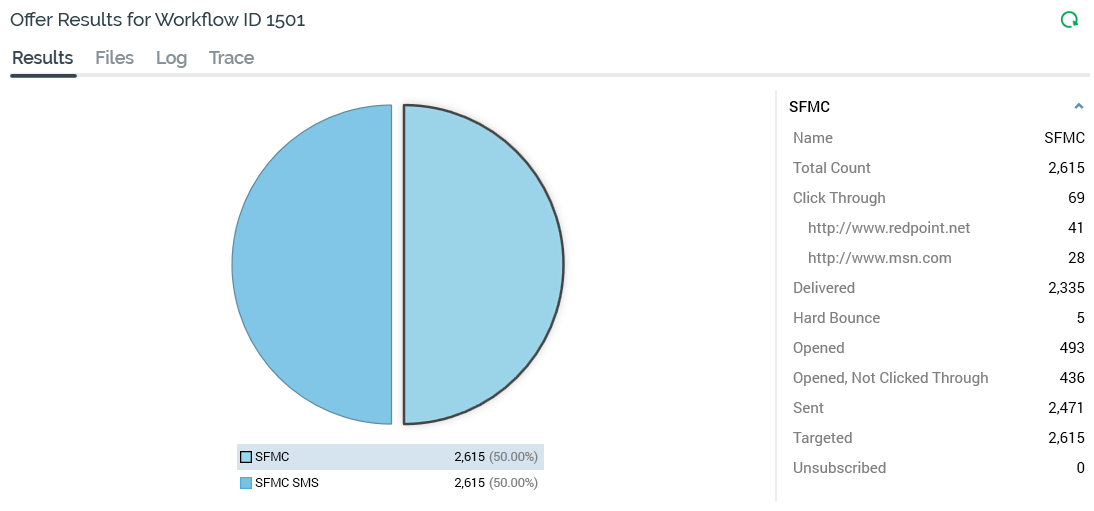
Results tab
The results tab displays results for the currently-selected activity. It contents depend upon the activity type and are discussed separately for each.
Files tab
The files tab gives you access to any files created by the activity’s execution. The tab is only displayed when relevant to the activity—for example, it is shown for offers and exports, but not for controls.
When files are available, the tab displays their read-only details.
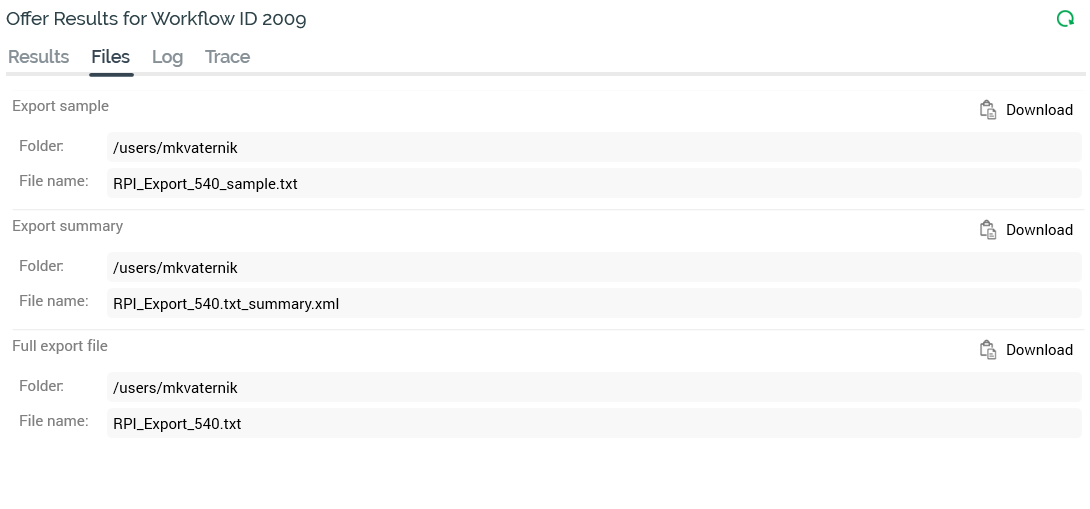
For each file, the following details are shown:
-
Folder
-
On the FTP server to which the file was transferred.
-
-
Filename
A button is displayed at each file. The button shown depends on the value of configuration setting File Export Location at the time of workflow execution.
-
If the setting is set to 0 (SFTP not configured), a Download button is displayed. Access to the button is controlled by the Interaction – Download functional permission. When you select it, a “Download file from server” Windows file system dialog is displayed. Files’ names default as follows:
-
RPI_Export_[ID].txt (full export file)
-
RPI_Export_[ID].txt_summary.xml/txt (summary file; XML format unless export in JSON format, in which case also JSON)
-
RPI_Export_[ID].txt _sample(sample file)
You can select a location on a local or accessible network file system within which to save the file.
Having initiated the download, a File download job is created and displayed in the My Jobs Dialog. Full details of the job and Dialog can be found in the My Jobs documentation.
-
-
If the setting is 1 (Default FTP location), a Download button is displayed. When you select it, a “Download file via FTP” Windows file system dialog is displayed. Files’ names default as follows:
-
RPI_Export_[ID].txt (full export file)
-
RPI_Export_[ID].txt_summary.xml/txt (summary file; XML format unless export in JSON format, in which case also JSON).
-
RPI_Export_[ID].txt _sample(sample file)
-
You can select a location on a local or accessible network file system within which to save the file.
Having initiated the download, a File download job is created and displayed in the My Jobs Dialog. Full details of the job and Dialog can be found in the My Jobs documentation.
If an audience waterfall report was generated during audience execution (due to one of settings Generate waterfall report in (Test/Prod) being checked at its audience definition), it can be accessed from the Files tab. The report is detailed separately in the Results Window documentation.
If one or more audit files were generated during fulfillment activity execution, they are available at the Files tab.
Audit files are always written to the default file system location.
When files are not available, through the activity having been executed in Test mode without file creation having been requested, a message is shown that states “Files are only available in Test mode when the activity is configured to generate them, and/or when the audience definition used is configured to generate an audit file”.
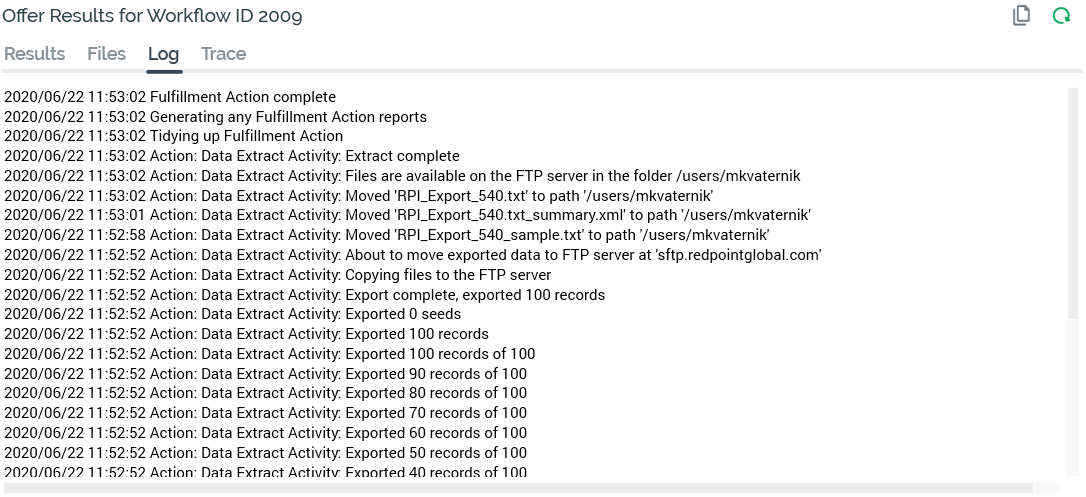
Log tab
The log tab is displayed for all activities and contains a list of log messages written during activity execution, displayed in reverse chronological order.
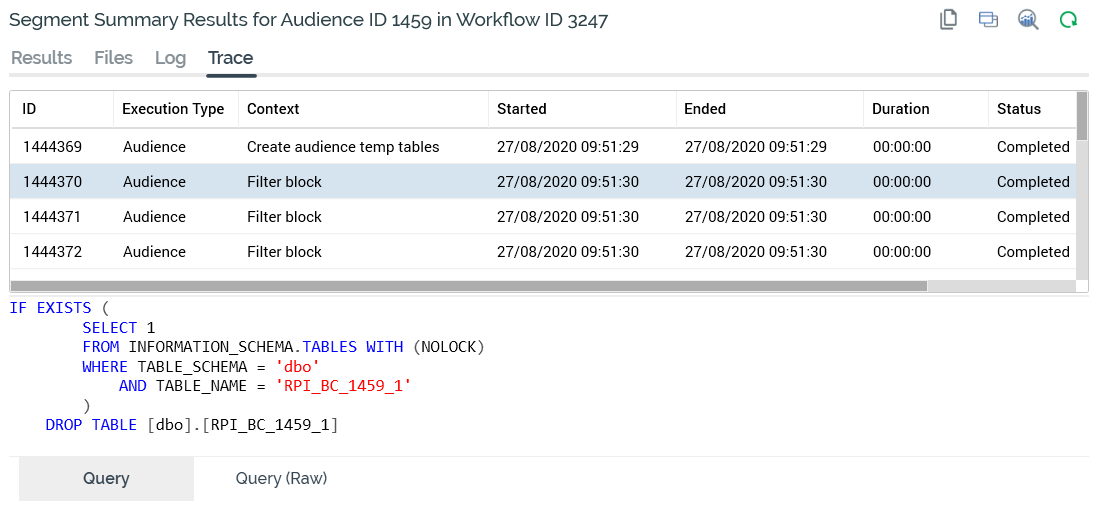
Trace tab
The Trace tab provides visibility of the query statements executed during audience or fulfillment activity execution.
It contains the following:
-
Trace entries grid: the grid lists the individual statements that were executed when the audience or fulfillment activity ran. The following columns are shown:
-
ID
-
Execution type: one of Audience or Fulfillment
-
Context: describing the scenario in which the query was executed
-
Started: date/time
-
Ended: date/time
-
Duration: hh:mm:ss
-
Status
-
Result
-
Trace entries are displayed in ascending chronological order, with the earliest statements being shown first.
-
Selected trace entry details: this read-only section is displayed below the grid and contains up to three tabs.
-
Query: shows the detail of the statement selected currently in the grid. The query is formatted.
-
Query (Raw): shows the detail of the statement selected currently in the grid. The query is unformatted.
-
Error Message: this tab is only available when errors occurred during execution of the currently-selected trace log entry. Full error details are displayed.
-
You can copy trace statements to the clipboard using the toolbar button provided. When you do so, two hyphens are added at the beginning of any non-query lines of text. The same applies at any error messages. This makes it easier to execute any resultant SQL immediately in a SQL execution environment (e.g. SQL Server Management Studio).
Recurrences tab
This tab is only shown at a single-instance recurring workflow, or at an interactive activity, when two or more recurrences of a workflow having executed exist. The tab is displayed at all activity types within the recurring workflow, or downstream from the interactive activity.
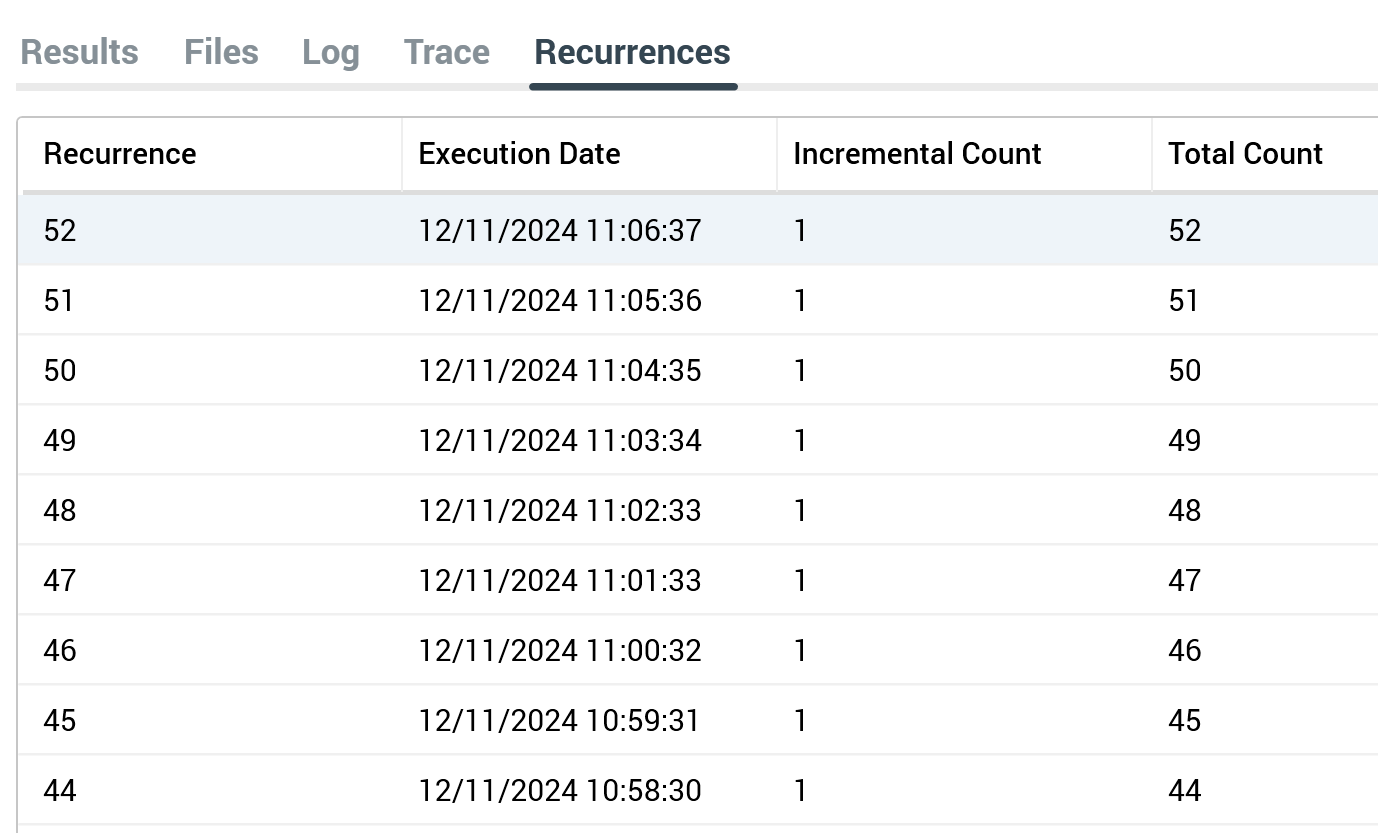
The tab contains a read-only table, which contains the following columns:
-
Recurrence: an integer. If multichannel offer results are being displayed, one row per offer channel is shown, with '[Integer] - [Offer Channel Name]' being displayed at each.
-
Execution Date
-
Incremental Count
-
Total Count
Rows in the table are shown in descending Recurrence order. The most recent 50 recurrences are displayed.