Overview
An RPI pivot table expands upon the capabilities of the crosstab panel, facilitating the cross-tabulation of up to eight attributes.
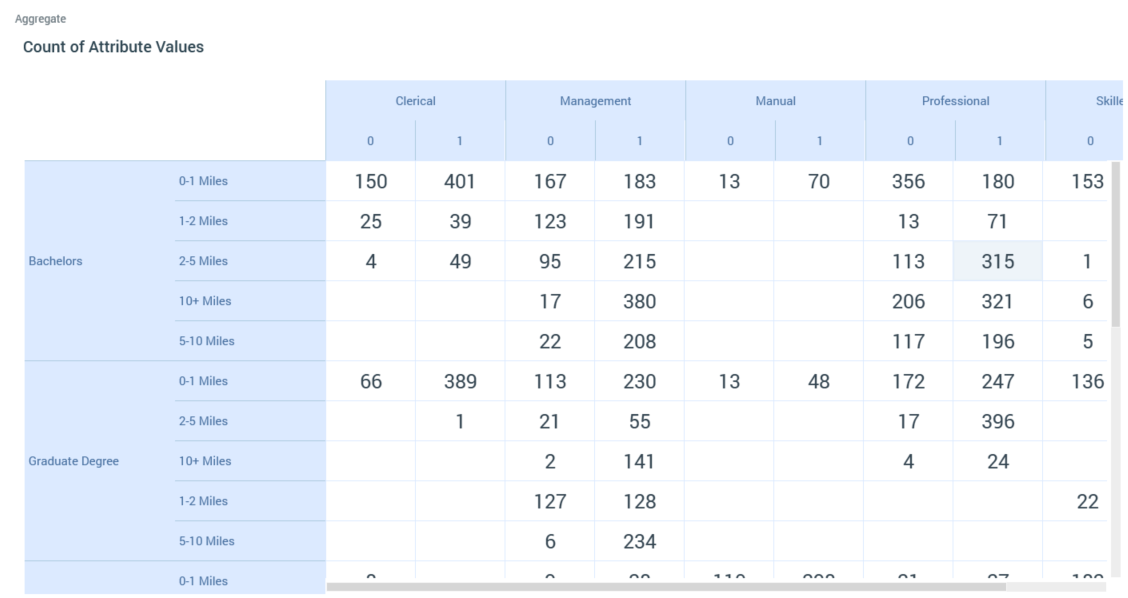
Like the crosstab, a pivot table also supports provision of a Function attribute, which can be aggregated in the context of each cell to produce a count value.
A pivot table consists of the following elements:
Resolution/Definition
A pivot table can be based on attributes sourced from a SQL or NoSQL database, depending on whether a resolution level or NoSQL database collection definition is selected at this property.
Note that any attributes used to configure the panel must be compatible with the value selected here.
Toolbox
A pivot table’s toolbox is shown to the left.
Its display is controlled by the Show/hide Toolbox button. It is shown automatically when a chart is created or opened.
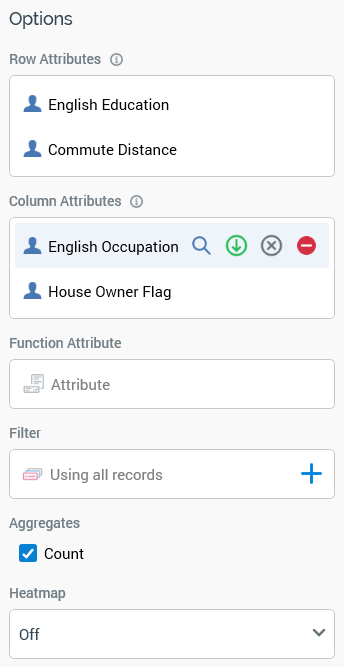
It exposes a number of Options:
-
Row Attributes: you must specify at least one Row attribute to display a pivot table. You can add row attributes by dragging one or more attributes from the toolbox and dropping them onto the property. You cannot add a parameter, model project or exists in table attribute. A maximum of four row attributes can be added to the pivot table. If the total maximum number of attributes—eight—have already been added across the pivot table’s three lists, an informational message is displayed and any excess attributes are not added. Having added an attribute to the Rows or Columns list, a series of buttons are displayed on hover:
-
View file information...: selecting this button displays details of the attribute in the File Information Dialog.
-
Move attribute up: this button is only available if the attribute is not the first in the list. Selecting it moves the attribute up one position within the list.
-
Move attribute down: this button is only available if the attribute is not the last in the list. Selecting it moves the attribute down one position within the list.
-
Remove attribute: removes the attribute from the pivot table without displaying an “Are You Sure?” dialog.
-
-
Column Attributes: you must specify at least one Column attribute to display a pivot table. For more information on Column attributes, please see the Row Attributes documentation.
-
Function attribute: this optional property defines an attribute that can be aggregated and analyzed in the context of cells within the pivot table’s results grid. You can browse for an attribute using the recent items chooser or File System Dialog, or you can provide one using drag and drop. Once provided, you can clear the selected attribute, or invoke View Information... to view its details in the File Information dialog. The attribute selected must be numeric, cannot be same as one of the Row or Column attributes, cannot be a model project, exists in table or parameter attribute, and cannot be a function attribute configured with a constant value. The attribute selected must be sourced from the same database as the panel’s resolution level.
-
Filter: this optional property allows you to provide a selection rule that will be executed at the point of the pivot table’s being refreshed, thereby limiting the cell counts therein to include just records that match the selected filter’s criteria. A Filter is initially not provided, with a message (‘Using all records’) being shown instead. You can browse for a selection rule with which to configure the property, or you can provide one using drag and drop. You can also initiate the creation of a new selection rule to serve as the pivot table’s Filter. Once a Filter has been provided, you can open its latest version in the Rule Designer or clear it if required. Note that the resolution level of the chosen selection rule must be from the same database as the panel’s resolution level. When a Filter has been applied, it is displayed within the panel.
-
Aggregates: this property allows you to control the type of count values displayed at cells within the pivot table results. A list of available aggregates is displayed when a Row attribute or Column attribute are provided. Each is accompanied by a checkbox. If a Function attribute is not provided, only a single Count aggregate is available, and is checked by default. In the absence of a Function attribute, a pivot table can only display simple counts of the intersects between Row and Column attribute values. If a Function attribute is provided, the following Aggregates are available:
-
Count: the Function attribute is ignored, and a simple count of the intersection of attribute values is provided per cell.
-
Minimum: the minimum Function attribute value per cell.
-
Maximum: the maximum Function attribute value per cell.
-
Sum: the sum of all Function attribute values per cell; always available.
-
Average: the average of all Function attribute values per cell.
-
At least one aggregate must be checked prior to invocation of Refresh.
Note that, if only the Average aggregate is selected, on refreshing the pivot table, the Sum aggregate will also be available (due to sums being calculated as part of average calculation during pivot table refresh).
-
Heatmap: you can apply a colored heatmap to pivot table results . By default, a new pivot table’s Heatmap is set to Off. You can select the property to display available heatmap options using the dropdown:
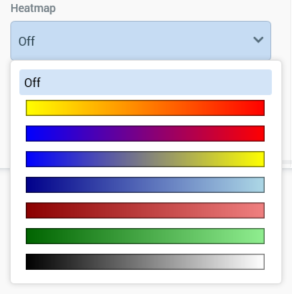
Upon selecting a heatmap color range, the selected color gradient is applied at pivot table results:
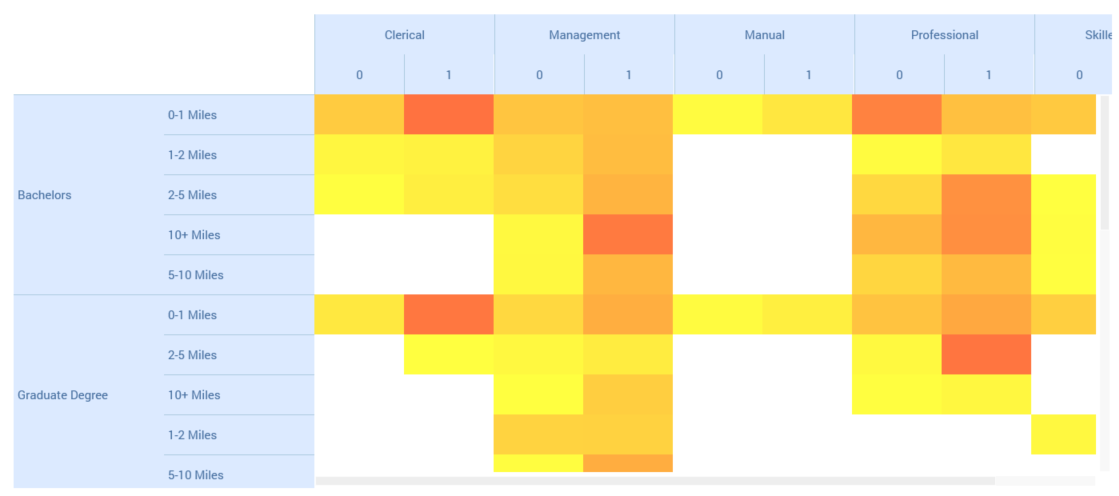
Count values are not shown when a heatmap applied, unless a cell is hovered over.

The selected Heatmap setting is persisted along with the analysis panel and applied each time results are refreshed. The lowest value takes the leftmost gradient color, and the highest value takes the rightmost gradient color. Any change to the heatmap setting is applied immediately to displayed pivot table results. Coloration is removed if the Heatmap setting is set to Off. Cells with no data are displayed in white.
Note that the configuration panel is read-only when a pivot table panel is refreshing.
Pivot Table
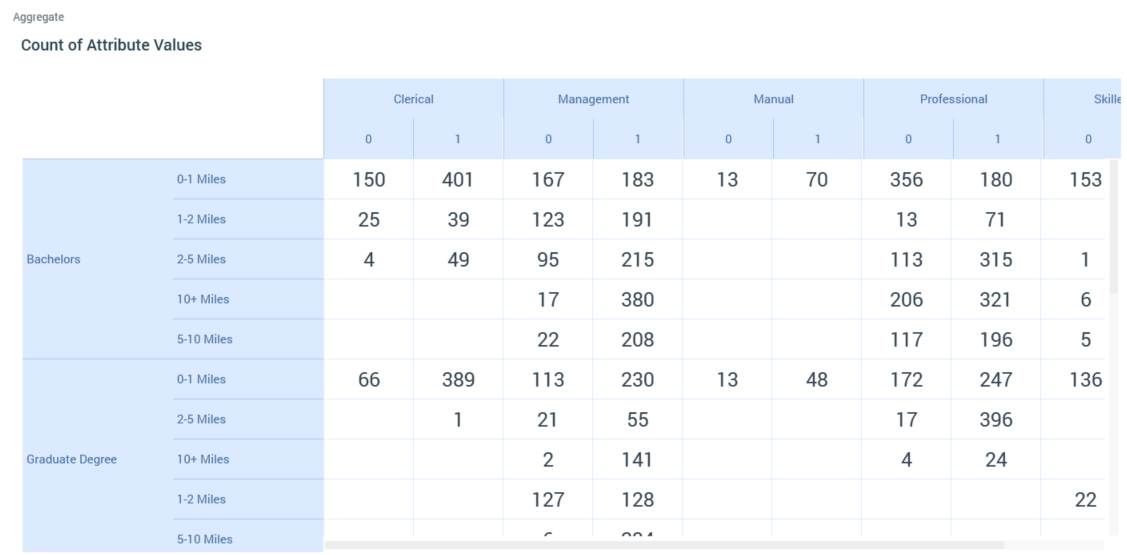
When initially displayed, a message is shown at a pivot table that says “Please configure this panel and refresh to view results”. When a pivot table has been refreshed, and its results displayed, the following are shown:
-
Aggregate: set to the current Aggregate’s name. If more than one aggregate was checked, you can select which to view by selecting the title and selecting from a dialog:

-
Column headers: one column is displayed per attribute in the Columns attributes list. The position of an attribute within the Columns list determines its position within the results. The first attribute’s values are displayed once. If supplied the second attribute's values are displayed for each of the first attribute's values. The same pattern applies at the third and fourth attributes. If a column contains no results, it is not shown. On hovering over a column header value, a tooltip displays:
-
Attribute name
-
Attribute value (raw database)
-
-
Row headers: as Column headers, other than the top attribute is displayed to the left.
-
Table data: a value is displayed at each cell that represents a combination of row and column values. If no data are present within a cell, it is shown as empty. Table cell counts represent the following:
-
If a Function attribute was not supplied, the cell contains the count of records at the selected resolution level that match the cell’s column and row attribute values.
-
If a Function attribute was supplied:
-
If the Count aggregate is displayed, a cell shows the same value as if a Function attribute were not provided: the count of records at the selected resolution level that match the cell’s column and row attribute values.
-
If an aggregate other than Count is displayed, a cell shows the aggregated value of the Function attribute in the context of the cell’s row and column values. For example, if Function attribute Yearly income and aggregate Average are selected, a cell will display the average yearly income for its unique combination of row and column values.
-
-
A cell is selected when you hover over it. On right-clicking a cell, a Create New Selection Rule from Cell option is displayed at a context menu. Invocation creates a new standard selection rule, pre-configured with criteria accordant with the cell’s Row and Column Attribute values, and displays it in the Rule Designer, after all currently-displayed rules and panels. The new rule is named ‘New Pivot Table Rule’. The option is not available when the panel is popped out.
A maximum number of 100,000 records in total, or 100 distinct values per column or row, can be retrieved when you refresh a pivot table. If a larger number than this are returned, a message is displayed at the bottom of the pivot table workspace.
When you open a pivot table, if results had been generated previously, the most recently-generated version thereof is displayed automatically at the panel. For more information on previously-generated results, please see the Chart Workspace documentation.
Actions Menu
A pivot table’s Action menu is displayed at its header. An additional option is available at a pivot table:
-
Copy Data to Clipboard: this option allows you to copy a pivot table’s tabular data to the clipboard, for later pasting into e.g. Excel.

