Overview
An RPI Venn diagram allows a number of Venn sets, each defined using a selection rule, to be configured against the background of an optional universe filter.
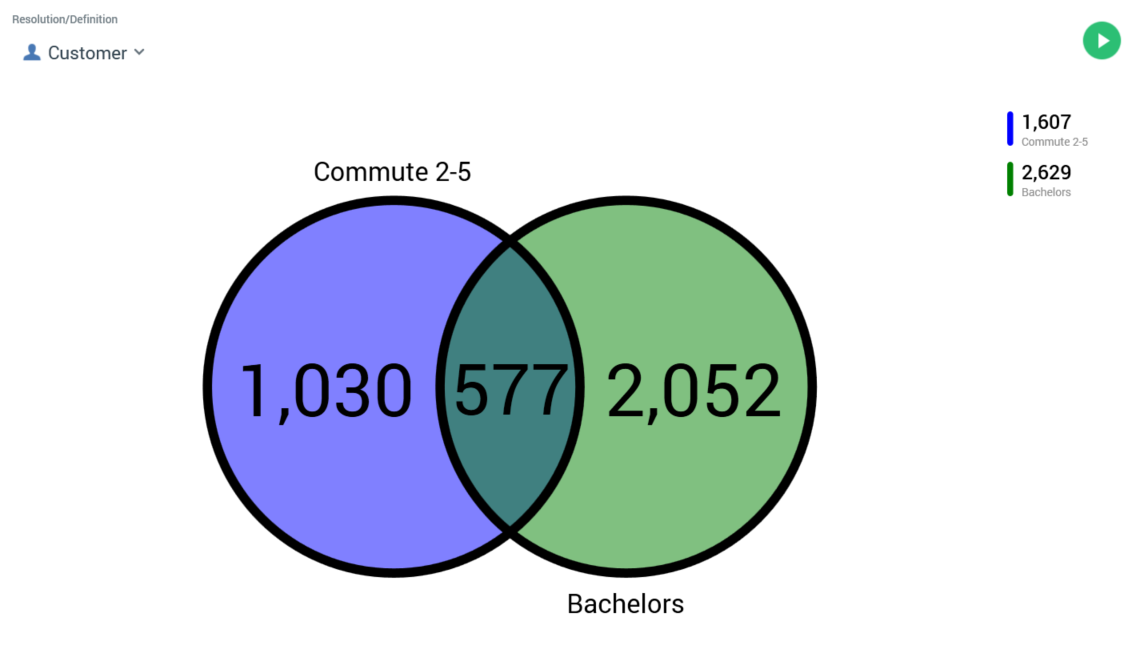
Having prepared the Venn diagram, you can refresh the counts of the Venn sets and the intersects between them. You can then choose to create new selection rules by dragging segments of interest and dropping them onto the Rule Designer workspace.
A Venn diagram consists of the following elements:
Resolution/Definition
A Venn Diagram can be based on attributes sourced from a SQL or NoSQL database, depending on whether a resolution level or NoSQL database collection definition is selected at this property.
Toolbox
A Venn Diagram’s toolbox is shown to the left.
Its display is controlled by the Show/hide Toolbox button. It is shown automatically when a Venn Diagram is created or opened.
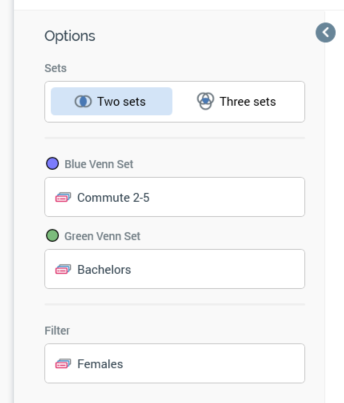
It exposes a number of Options:
-
Sets: you can use this property to choose whether to display two or three Venn sets. By default, a new Venn diagram is configured with two sets. If you change a three-set diagram to a two-set diagram, having configured all of the former’s Venn sets, the top two Venn sets are retained in the latter context; on reverting back to a three-set diagram, the original third Venn set’s selection rule configuration is lost.
-
Blue/Green/Red Venn Set: you must associate each displayed Venn set with a selection rule (standard, basic or NoSQL). You can specify a selection rule using browse or drag and drop. The resolution level or definition of a Venn set selection rule must be from the same database as the panel’s resolution level/definition. Having populated a Venn set’s selection rule, you can open its latest version in the Rule Designer. You can also clear the selection rule.
You can also populate a Venn set by dragging a selection rule from the toolbox and dropping it directly onto a set displayed within the Venn diagram.
In addition, you can populate a Venn set by dragging an attribute from the toolbox and dropping it directly onto a set displayed within the Venn diagram itself. When you do so, the Criterion Builder is displayed to allow creation of a criterion within a new standard selection rule, which is displayed in the Rule Designer and named “[Attribute Name] Selection Rule”. The matching Venn set property is also set to the new rule, with the fact that the new rule has yet to be saved indicated via using italic font (this is removed when the rule is saved). The new Venn set selection rule setting is retained even if you cancel creation of the criterion.
If you wish, you can save a Venn diagram containing a link to an unsaved selection rule. If you do so, you can open the unsaved selection rule from the Venn diagram using an Open this version button.
-
Filter: you can provide an optional filter to define the universe of records against which the Venn diagram will be run. You can select the property to browse for an existing selection rule from the RPI file system, or you can populate the filter by dragging a selection rule from the toolbox and dropping it onto the property. Once set, you can open the filter’s latest version in the Rule Designer. You can also clear the filter. Note that the resolution level of the chosen selection rule must be from the same database as the panel’s resolution level. You can populate also a Venn diagram’s filter by dragging an attribute from the toolbox and dropping it directly onto the Venn diagram canvas(avoiding its Venn sets when doing so). The attribute used must be sourced from the same database as the panel’s resolution level. Note that you cannot drop an attribute onto the Filter property itself. Parameter attributes are not supported in this context. When you do so, a new selection rule is created and the Criterion Builder displayed, as per configuring a Venn Set using an attribute. Please see the preceding section for further information. When a Filter has been applied, it is displayed within the panel.
Venn Diagram
A two-or-three set Venn diagram is displayed to the right of the toolbox:
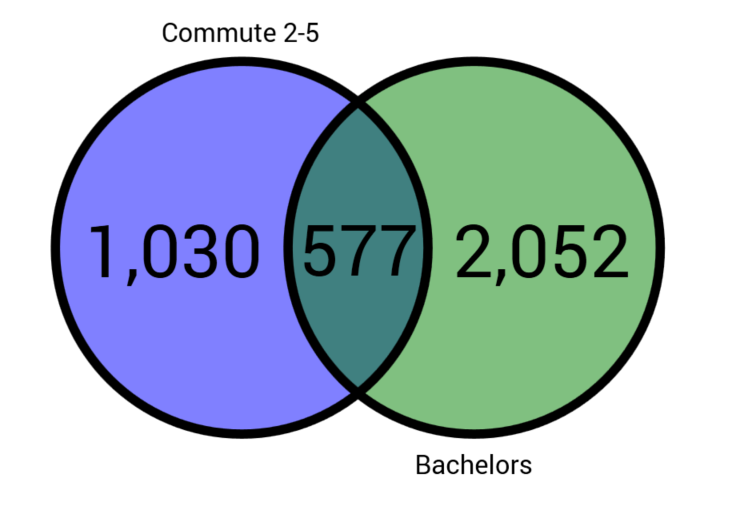
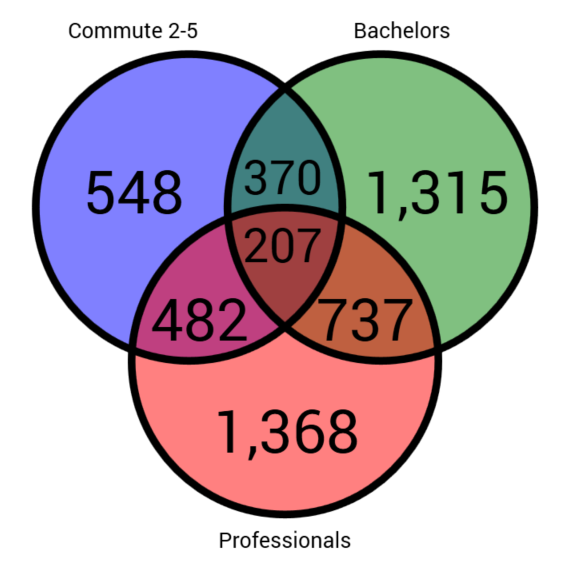
A colored circle is displayed for each Venn set. The circle’s color is intensified when it is configured with a selection rule:
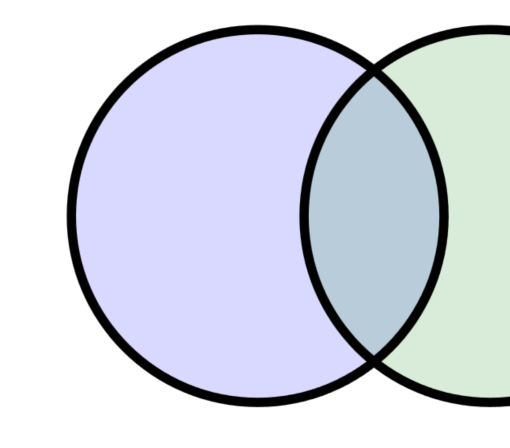
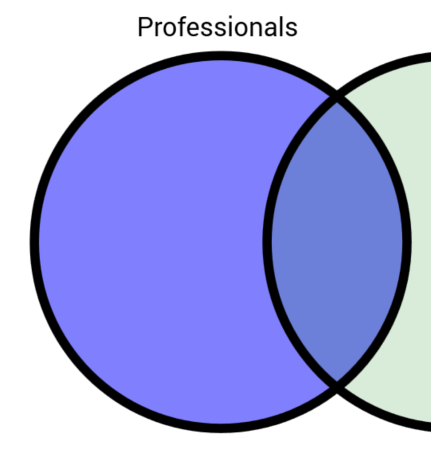
Once a Venn diagram’s counts have been displayed, hovering over a Venn set (or an intersect within the diagram) displays the hovered context in the lighter color.
When you hover over a Venn set with a dragged selection rule, the Venn set is temporarily blanked:
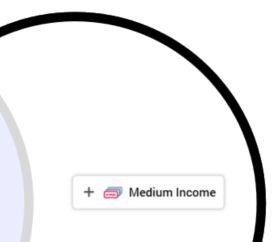
Dropping at this point configures with Venn set in question with the selection rule.
When you open a Venn diagram, if results had been generated previously, the most recently-generated version thereof is displayed automatically at the panel. For more information on previously-generated results, please see the Chart Workspace documentation.
A Venn diagram’s principal function is to provide an alternative method to building standard selection rules, other than through manual configuration.
Once you have populated Venn sets with selection rules, you can right-click a segment and choose the Create new Selection Rule from Segment context menu option thus displayed.
A new standard selection rule is created and displayed in the Rule Designer. It is named “New Venn Diagram Rule” (an incrementing integer can be appended to the name to ensure uniqueness). The rule contains linked selection rules in accordance with the Venn set and filter selection rules that define the segment on which the selection rule is based.
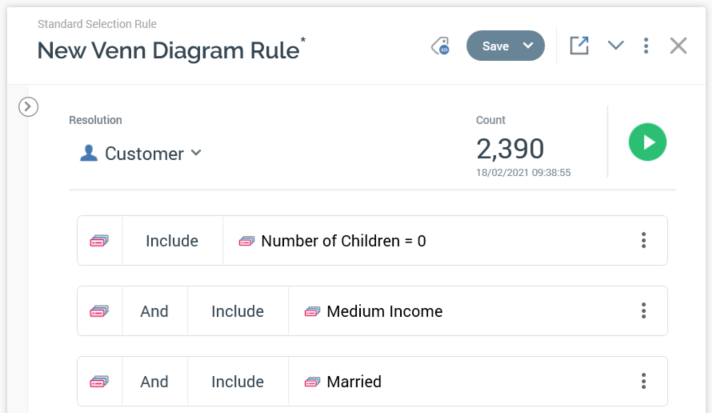
In addition, the new selection rule’s resolution level is set to the same value as the Venn diagram from which it was created (with any cross-resolution linked rules contained within criteria lists with appropriate resolution levels).
Legend
A legend, displayed to the right of a Venn diagram, provides a color-coded guide to the selection rules with which each Venn set is configured, along with the count of records at each.
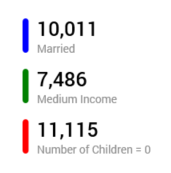
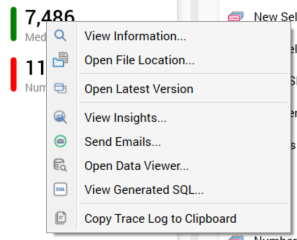
You can access functionality relating to each selection rule displayed at the legend by right-clicking the same to view a context menu.
