

Overview
Data Connectors
A message stating “No Data Connectors were found that match the current filter” is displayed when no data connectors have been configured at the current RPI client.
If one or more data connectors has been configured, they are displayed in the list. By default, data connectors’ details are hidden. Paging is applied to the list, with a maximum of 20 data connectors being shown per page.
An Add New Data Connector button is displayed at the bottom of the list. Selecting it displays Add New Data Connector overlay.
Details hidden
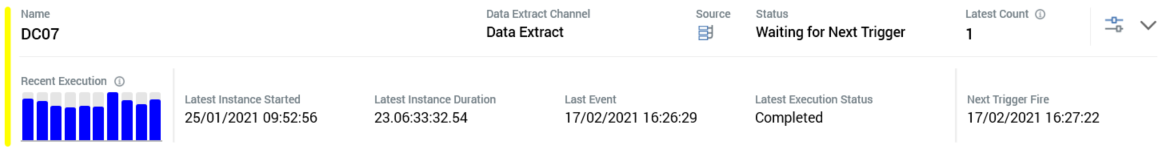
The following read-only details are shown at a data connector within the list when its details are hidden:
-
[Color bar]: the color bar displayed to the left of the connector illustrates its current status:
-
Gray: Not Started, Deactivation Requested, Trigger Deactivated
-
Yellow: Waiting for Trigger
-
Orange: Trigger Requested
-
Green: Playing
-
Blue: Completed
-
-
Name
-
Channel
-
Source: either a selection rule or audience icon is shown; file details are shown in a tooltip on hover.
-
Status
-
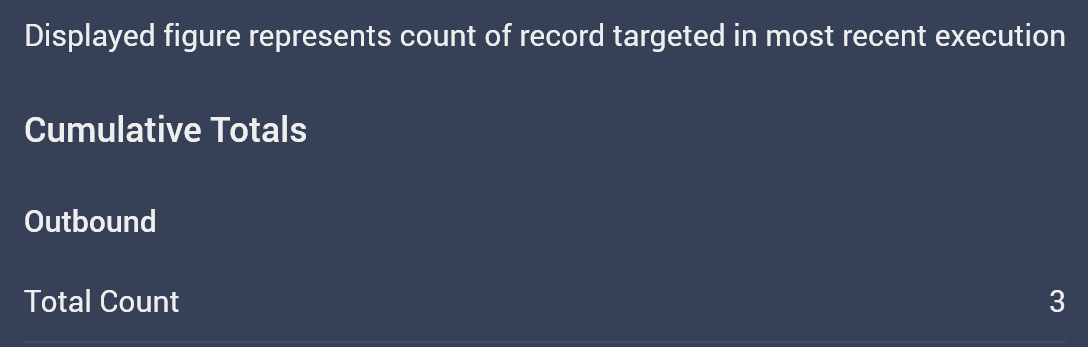
Latest Count: the count of records targeted in most the data connector's most recent execution. If the connector supports bi-directional data synchronization, Outbound and Inbound counts are displayed separately.
-
Options:
-
Manage this Data Connector: selecting this options displays the Manage Data Connector overlay.
-
Show/Hide Details: selecting this option shows or hides further details of the data connector (depending on its current state).
-
-
Show/Hide Details
Details shown
The following additional read-only properties are displayed at a data connector when its details are shown:
-
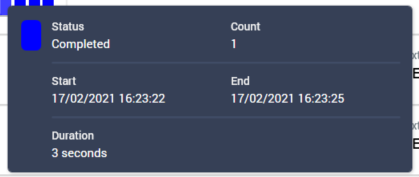
Recent Execution: a bar chart shows the relative durations of up to 10 of the most recent instances of the connector's execution. An information tooltip is shown on hovering over a bar:
-
Latest Instance Started
-
Latest Instance Duration
-
Last Event
-
Latest Execution Status
-
Next Trigger Fire
Add New Data Connector overlay
On its initial display, the Add New Data Connector overlay contains the following:
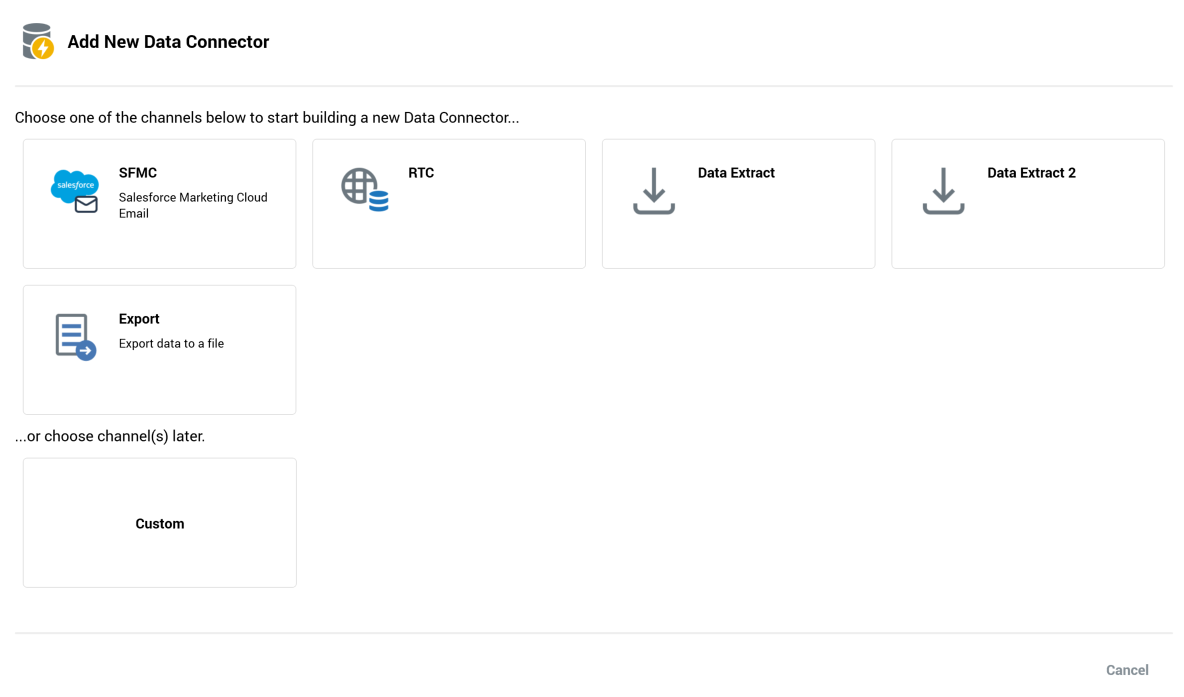
One button is shown for each configured channel of the supported types. The selected channel will be leveraged when the new data connector is executed. In addition, the following options are shown:
-
Export: allows for the writing of data to a file using an export template.
-
Custom: allows you to choose the channel(s) to be used by the data connector after its creation.
Choose an option to continue.
A single button is shown at the bottom of the overlay:
-
Cancel: clicking this button removes the overlay from display.
Having made your selection, the Manage Data Connector overlay is shown.
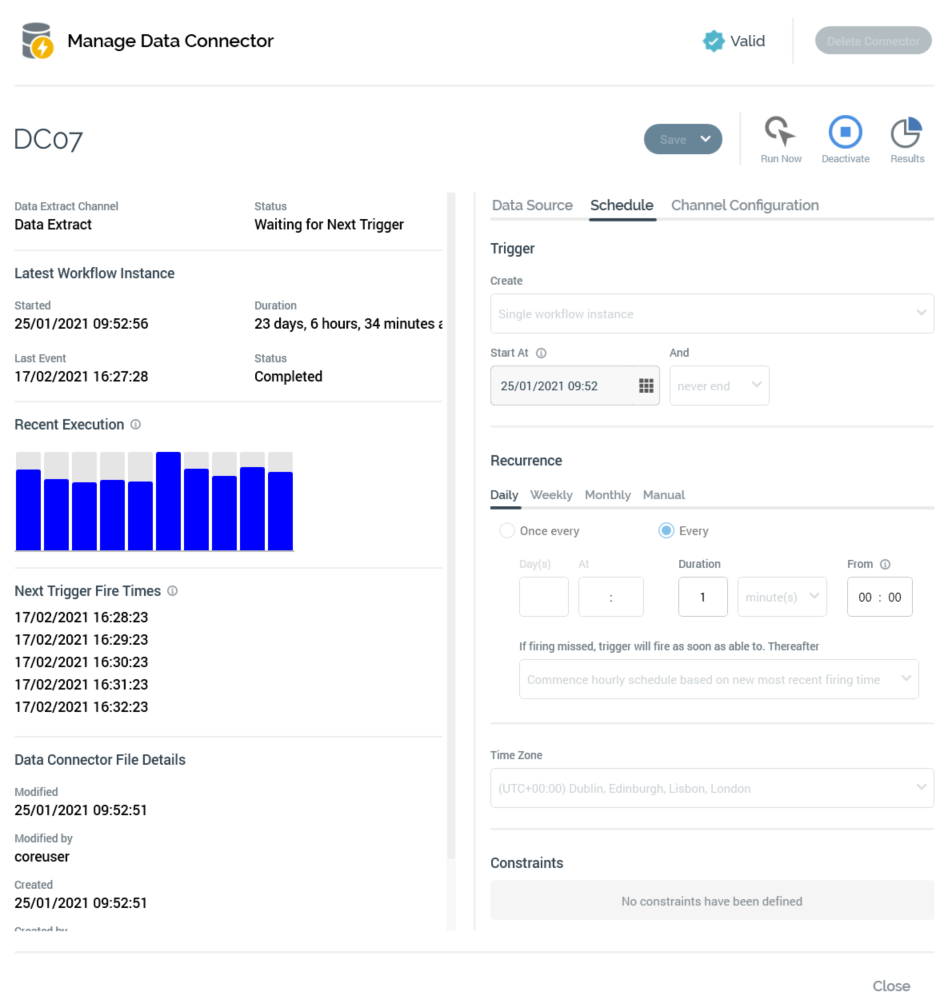
Manage Data Connector overlay
The Manage Data Connector overlay is used to view and edit a data connector’s properties, and invoke functionality in respect of the same.
It contains the following:
-
Validation status indicator: when the data connector is invalid, it appears as a red “x” icon. Selecting the indicator lists validation errors in a dialog. When the data connector is valid, the indicator appears as a blue checkmark icon.
-
Delete Connector button: this is displayed to the right of the validation status indicator. It is shown in gray, but becomes red when you hover over it.
The button is enabled when a data connector's status is one of Not Started or Completed. Selecting the button, which is protected by an “Are You Sure?” dialog, permanently deletes the currently-displayed data connector.
-
Name: defaults to “[Channel Name] Data Connector”. If a data connector with this name exists already, an integer is appended to ensure uniqueness. This value can be incremented.
Provision of a name for the data connector is mandatory, and the value provided can be a maximum of 100 characters in length. The name supplied must be unique across data connectors.
-
Save: the button is enabled when unsaved changes are present at the displayed data connector.
-
Clone and Save: this option, which is available at a menu accessed from the Save button, is enabled when managing an existing data connector. Selecting the button saves the current data connector as a new data connector, appending “1” to its name. The newly-created data connector's properties are identical to those at the data connector from which it was cloned, and its Status is Not Started.
-
Activate: this button is displayed when a data connector's Status is one of Not Started or Completed. Access is protected by the Data Connectors – Execute functional permission. Selecting the button initiates activity within the connector.
-
Run Now: this button is displayed when a data connector's Status is Waiting for Trigger. Selecting it immediately executes the data connector's next scheduled execution.
-
Deactivate: this button is displayed when a data connector's Status is Waiting for Trigger. It ceases activity within the data connector, and sets its Status to Trigger Deactivated.
-
Results: selecting this button displays the data connector's results in the Results Window.
Summary section
Displayed to the left of the Manage Data Connector interface, the summary section is only shown after a data connector is saved.
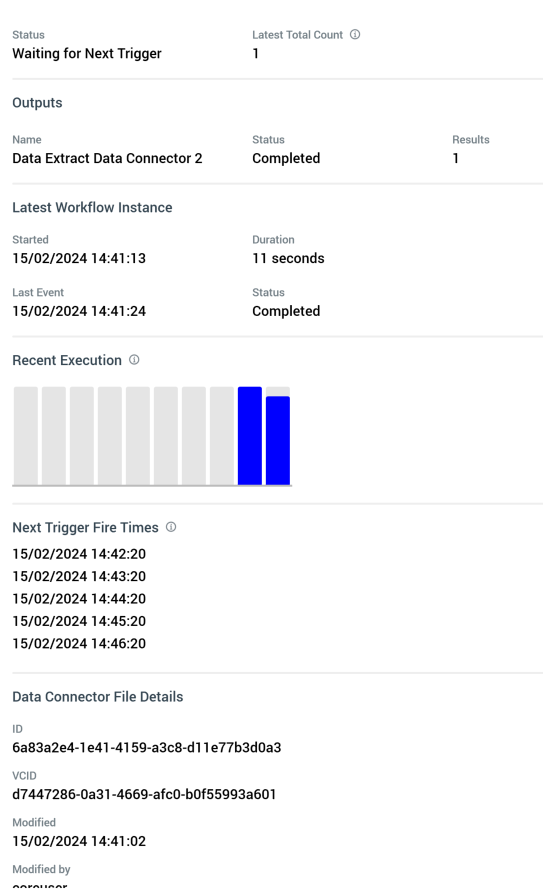
It contains the following read-only information:
-
Status
-
Latest Total Count
-
Hovering over the information tooltip to the right displays the following:
-
-
Outputs:
-
Name
-
Status
-
Results
-
-
Latest Workflow Instance
-
Started
-
Duration
-
Finished
-
Last Event
-
Status
-
-
Recent Execution (chart)
-
Next Tigger Fire Times
-
Data Connector File Details
-
ID
-
VCID
-
Modified/by
-
Create/by
-
Version
-
Footer
The following buttons can be displayed:
-
Cancel: displayed if outstanding changes exist in the data connector. Invocation removes the Manage… overlay from display. The button is protected by an “Are You Sure?” dialog.
-
Save & Close: selecting this button saves the data connector and removes the overlay from display.
-
Close: displayed if no outstanding changes exist in the data connector. Invocation removes the Manage… overlay from display.
Tab set
A tab set is shown to the right of the summary section (if shown—else occupying the entirety of the Manage Data Connector overlay). It contains up to four tabs: Data Source, Scheduled, Channel Configuration, and Output Configuration.
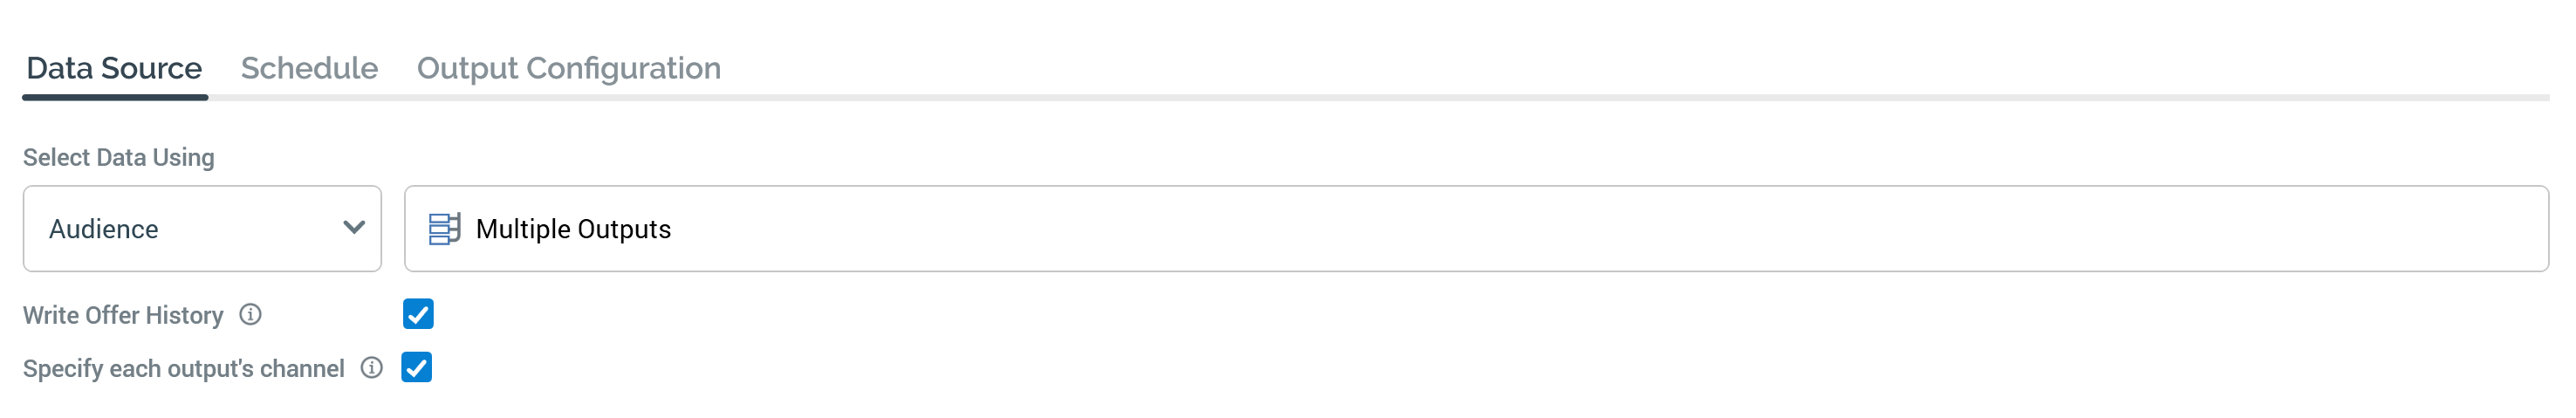
Data Source tab
The Manage Data Connector overlay’s Data Source tab contains the following:
-
Select Data Using: this dropdown property allows you to specify whether the data connector will source its data via an audience (the default), or a selection rule.
-
Audience: this property is displayed if Select Data Using is set to “Audience”. It is mandatory when shown. Selection of an embedded-only audience is not supported. You can populate the property using browse or drag and drop. You can also initiate the creation of a new item. Having chosen an audience, standard file property functionality is available. You can also clear your selection.
-
Selection Rule: this property is displayed if Select Data Using is set to “Rule”. It is mandatory when shown, and you can select a standard, basic, or NoSQL selection rule. You can populate the property using browse or drag and drop. You can also initiate the creation of a new item. Having chosen a selection rule, standard file property functionality is available. You can also clear your selection.
-
Write Offer History: this checkbox is unchecked by default. If checked, data will be written to offer history tables at data connector execution. An information tooltip accompanies this property stating “If checked, data will be written to offer history tables at data connector execution”.
The checkbox is not editable when the data connector is active.
-
Custom Offer History Table Name: this property is shown when Select Data Using is set to “Rule”, a selection rule has been selected, Write Offer History has been checked and Audience Definition is set to “Don't use a configured audience definition”. It allows you to specify the name of the offer history tables to be used by the data connector. The supplied table name is prefixed with “DC_”, and tables are created, if they do not already exist, at data connector execution. Provision of a value at the property is mandatory when it is displayed, and it accepts a maximum of 30 characters, all of which must be appropriate for use within database table name.
-
Additional Offer History Attributes: this optional property is also shown when Custom Offer History Table Name is displayed. It allows you to specify additional attributes to be persisted in offer history along with the rule's resolution key.
-
Configure each output separately: this option is shown if the selected audience has multiple outputs. If the property is unchecked, the Channel Configuration tab is shown. If checked, it is replaced with the Output Configuration tab. An information tooltip accompanies the property stating “If checked, each output can be configured separately”.
The checkbox is not editable when the data connector is active.
Schedule tab
The Manage Data Connector overlay’s Data Schedule tab contains the following:
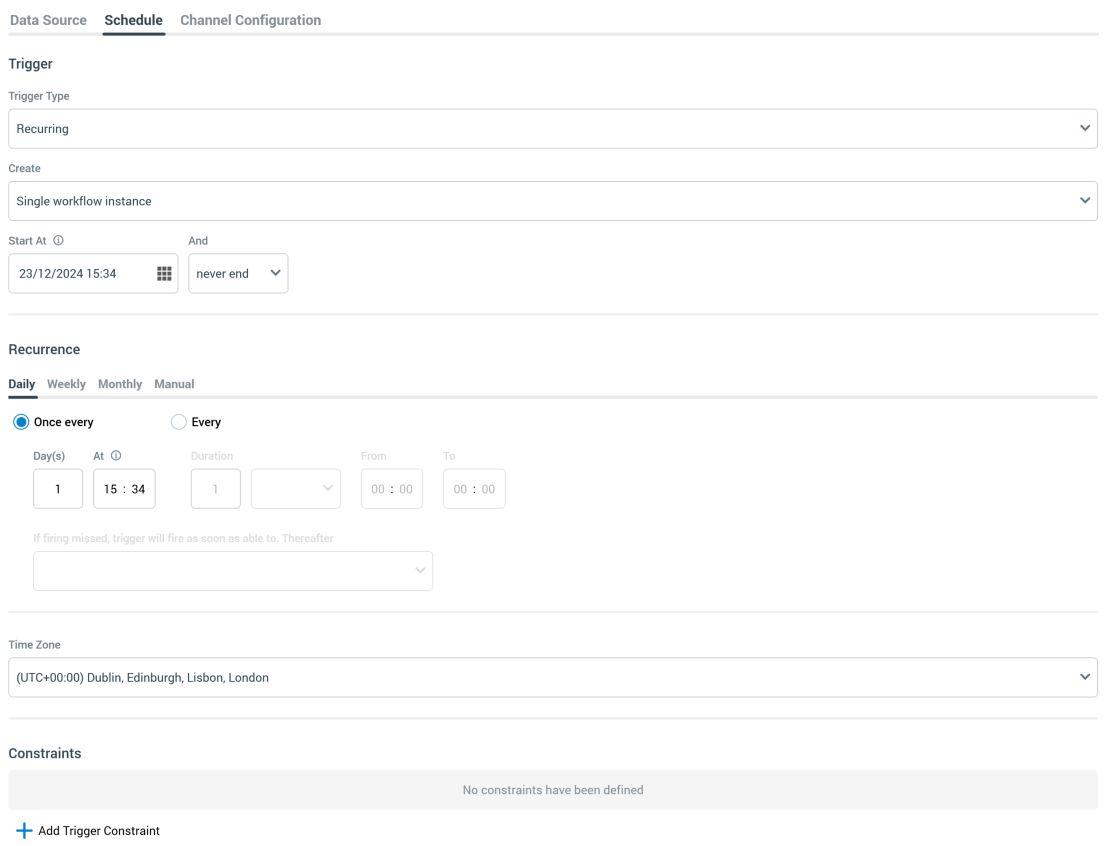
The tab’s contents allow you to specify the cadence at which the data connector will be executed. You can specify whether the connector will employ a Recurring trigger (the default), or a Scheduled trigger). On selection of either at the Trigger Type property, the tab’s contents mirror the respective trigger type’s configuration panel, details of which can be found within the Interaction Designer documentation.
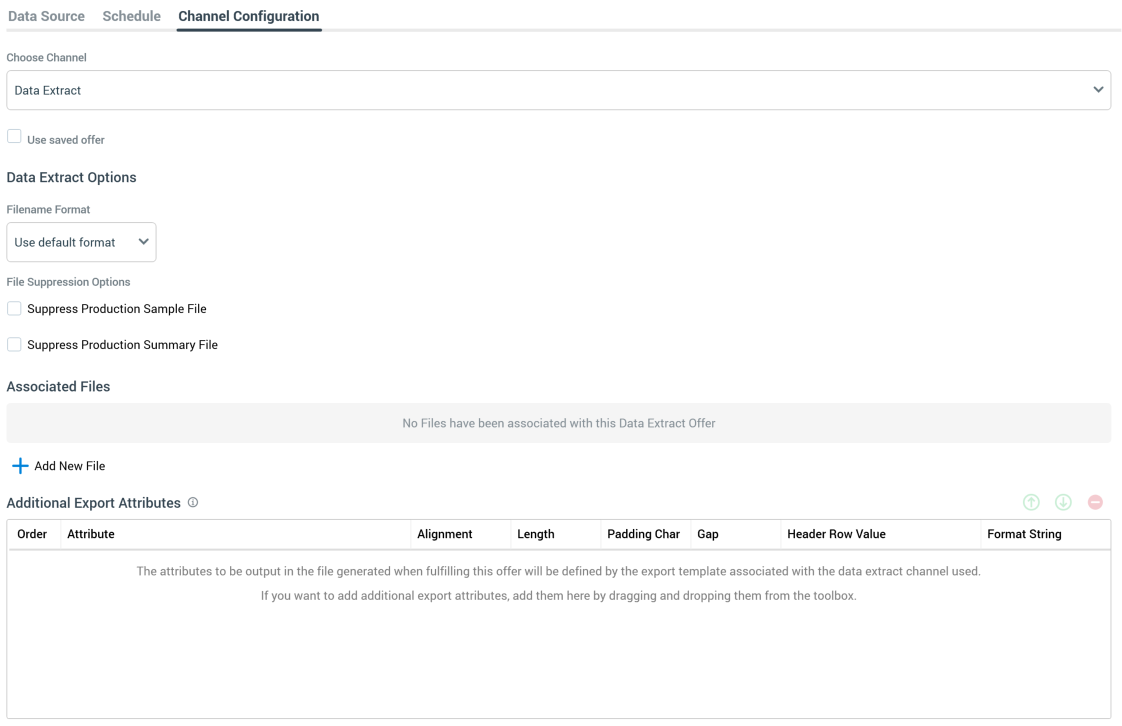
Channel Configuration tab
The Manage Data Connector overlay’s Channel Configuration tab is used to configure a channel when a data connector is configured with a single-output audience or a selection rule. It contains the following:
-
Choose Channel: this dropdown property lists all channels configured at the current RPI tenant that support usage at data connectors. If creating a new data connector, the property value is accordant with the option set at the Add New Data Connector overlay. If the Custom option was selected in that context, the property is blank. Selection of a channel is mandatory.
Having selected a channel, you can configure its specific offer properties. These are as per the requisite Offer Designer, unless cited below:
-
SFMC email:
-
Data Extension
-
you can select one or more data extension names as sourced from SFMC. A new data extension name will be created on saving the data connector. The newly-created data extension will only be reflected in the SFMC Portal upon initial Data connector execution. If the data extension name is left blank, the system will use the name “SFMC Email Channel” as a default.
-
-
Data Transfer Attributes
-
-
SendGrid:
-
List name
-
Sourced from SendGrid.
-
-
Data Transfer Attributes
-
-
Export:
-
The options displayed are as per the Interaction Designer's Export activity, other than that the following properties are not shown:
-
Export Method
-
Advanced Options>Create exports in Test mode
-
-
A validation error will be raised at data connector execution if more than 120 fields are used at the channel's configuration.
-
Use saved offer: this checkbox allows you to choose an existing offer instead of supplying channel-specific properties within the Channel Configuration interface. When checked, the Offer property is displayed. The checkbox is only available when a channel has been selected.
-
Offer: this file chooser property is mandatory when displayed. It allows you to select an offer to be used at data connector execution. You can populate the property using browse or drag and drop. When an offer has been selected, channel-specific properties aren't shown. The currently-selected channel's delivery method must be supported by the chosen offer. Having selected an offer, the following options are displayed when hovering over the property:
-
Open Latest Version
-
Clear
-
Output Configuration tab
The Manage Data Connector overlay’s Output Configuration tab is used to configure an audience output’s channels when a data connector is configured with a multi-output audience.
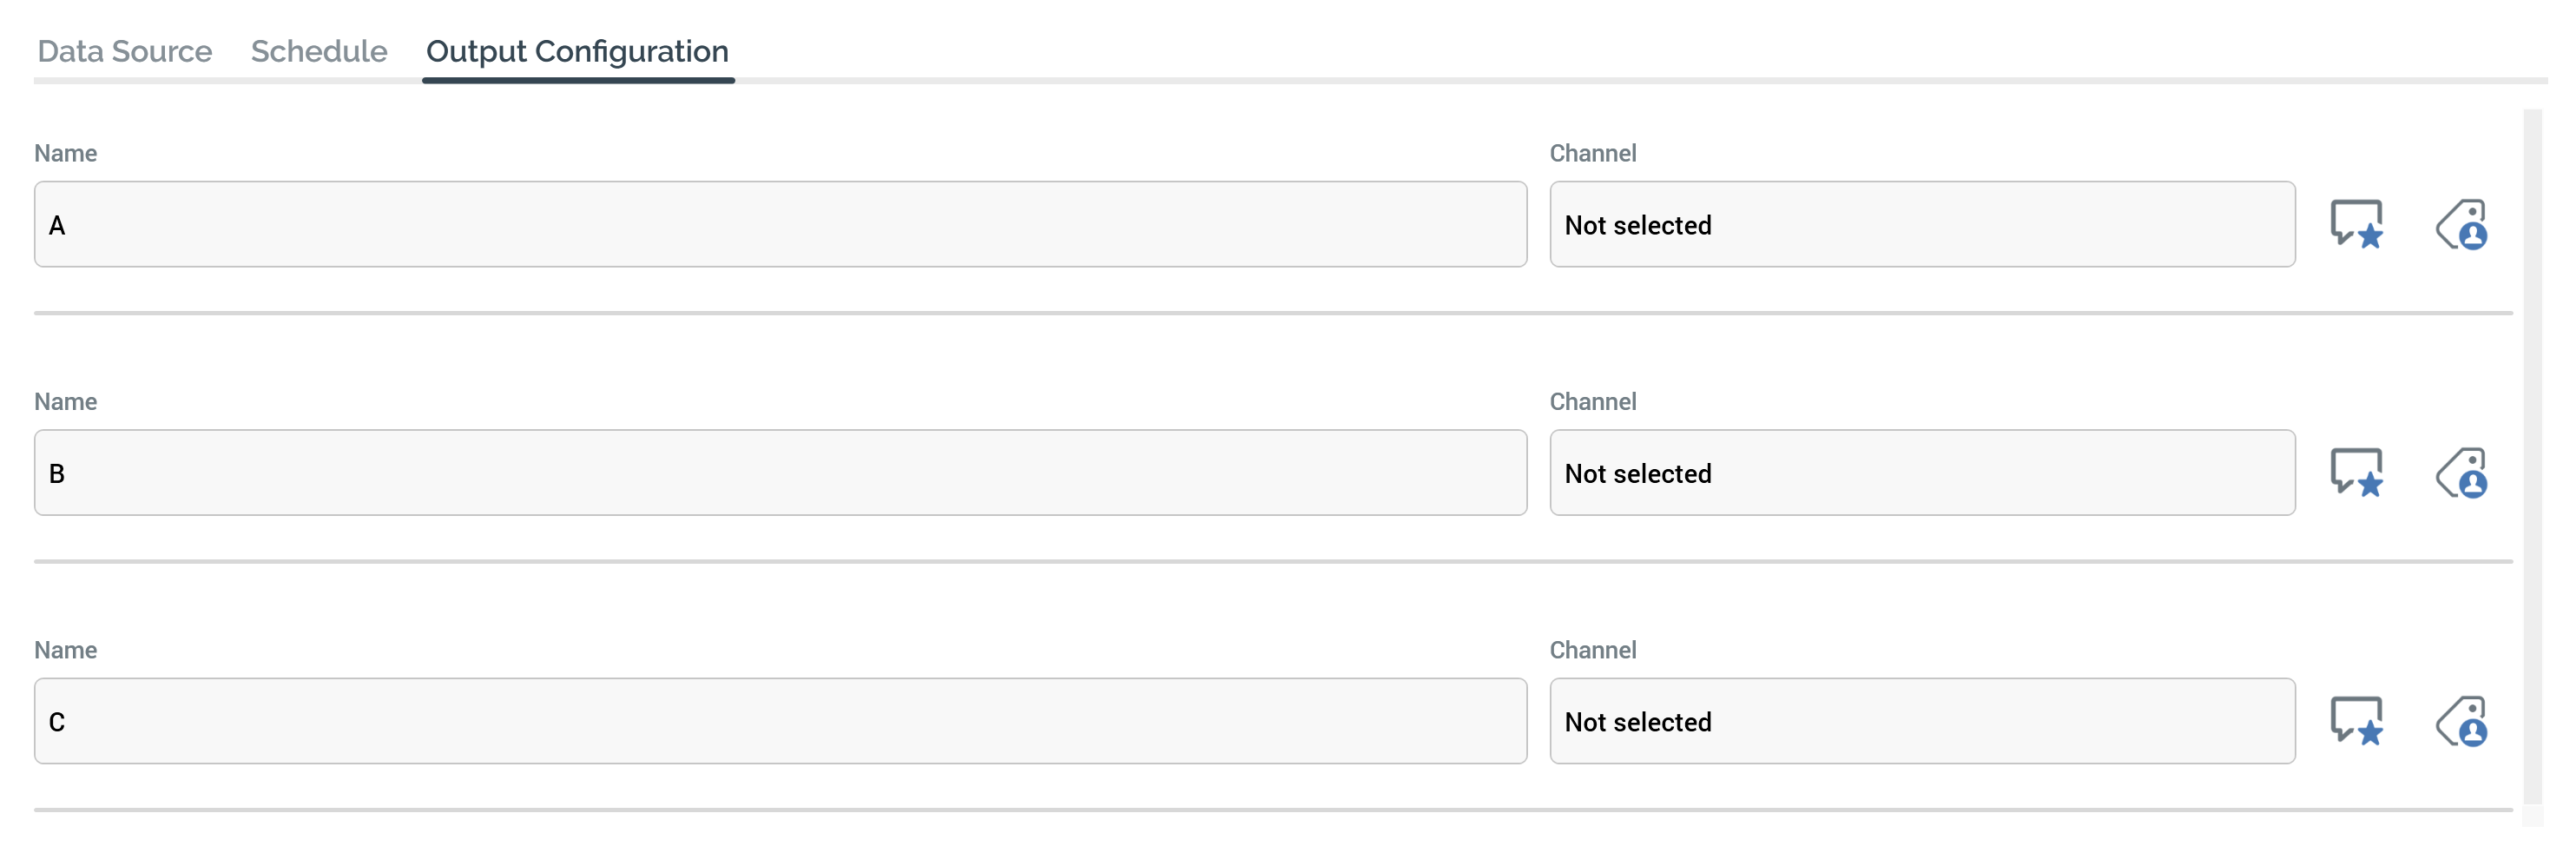
All of the audience’s outputs are listed. The follow read-only properties are displayed for each:
-
Name
-
Channel/Export Template (if an Export data connector)
Up to two buttons are displayed to the left of each output:
-
Configure: selecting this button displays the [Output Name] - Configuration overlay, which contains the following:
-
Choose Channel dropdown, or Export Template file chooser property (if an Export data connector)
-
Channel/Export properties
-
Both are described in the Channel Configuration tab section above.
It is mandatory for at least one of the data connector’s outputs to be configured with a channel.
-
Configure Metadata: this button is only displayed if the Write Offer History checkbox is checked. Selecting it displays the [Output Name] - Metadata Configuration overlay. The overlay facilitates the overriding of metadata attribute values on an output-by-output basis.