

Overview
This topic provides information about getting started with RPI Dashboards.
Dashboard Designer
The Dashboard Designer is displayed in its own tab in the RPI framework.
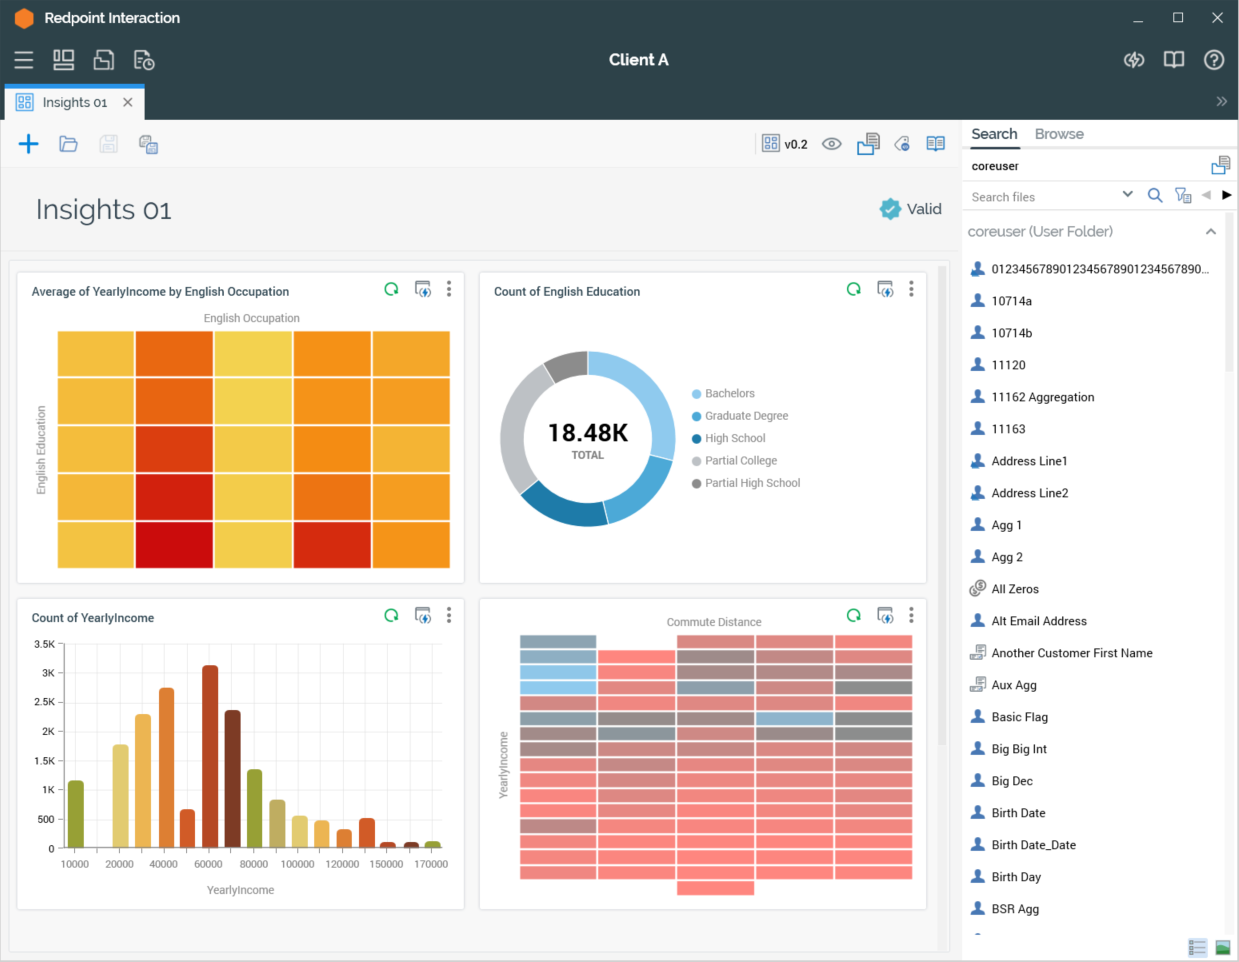
It is used to create and manage dashboards and the widgets that they contain.
The Dashboard Designer contains the following elements:
-
Toolbar
-
Properties
-
Toolbox
-
Widgets
Each of the above is documented separately.
Invoking the Dashboard Designer
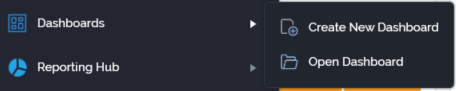
You can invoke the Dashboard Designer in the following ways:
From the quick access menu’s Dashboards menu. The menu exposes the following options:
-
From a Tasks or File Type widget. Typically, these might be displayed at your Home Page. For more information on widgets, please see the Dashboard Designer documentation.
-
By double-clicking a dashboard file in the File System Dialog, or by highlighting a dashboard and clicking OK in the same context.
Note that access to the Dashboard Designer is controlled via the Dashboard – Design functional permission. If none of the user groups of which you are a member are associated with this permission, you will not be able to able to access the Dashboard Designer.
Closing the Dashboard Designer
You can close the Dashboard Designer by closing the tab within which it is displayed, or by shutting down RPI itself. If you do so when the Designer contains a dashboard with unsaved changes, a dialog is shown, within which you can choose to do the following:
-
Save the changes and proceed with closing the Dashboard Designer
-
Abandon the changes and proceed with closing the Dashboard Designer
-
Cancel closing the Dashboard Designer or RPI.
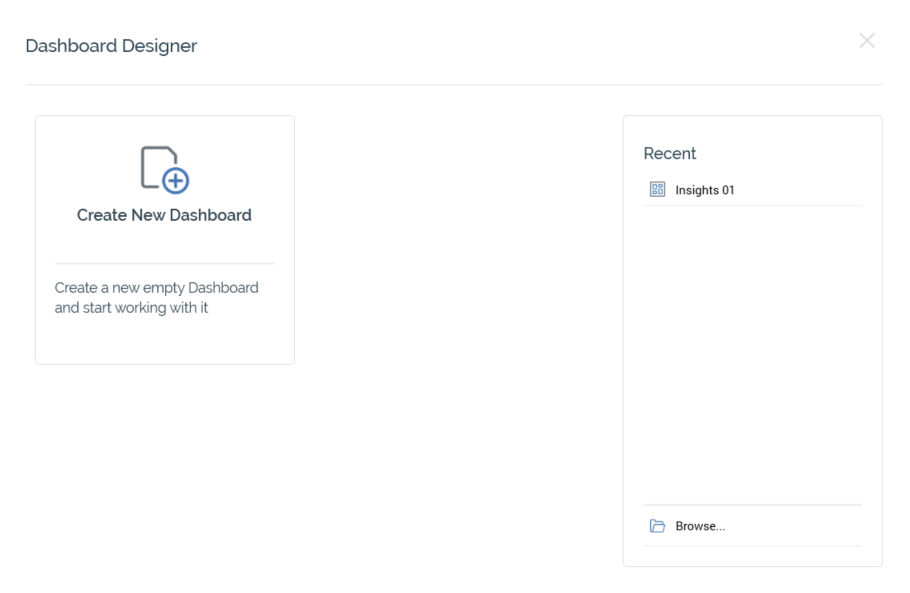
Start Page
The Dashboard Designer Start Page is shown upon invocation of Dashboards at the quick access menu, and also on clicking Create new Dashboard at the Dashboard Designer toolbar. It contains the following:
-
Create New Dashboard button. Clicking the button displays a new, unconfigured Dashboard in the Dashboard Designer.
-
Recent: lists recently-accessed dashboards, facilitating the opening of the same.
-
Browse: displays the Open Dashboard File System Dialog, allowing you to select a dashboard to open.
A Cancel button is shown at the top of the Start Page. Clicking it removes the Start Page from display, and redisplays the Dashboard Designer. The Cancel button is only shown on invocation of the Start Page by clicking Create new Dashboard at the Dashboard Designer toolbar.
Toolbar
The Dashboard Designer toolbar exposes the following options:
-
Create new Dashboard: clicking this button displays the Dashboard Designer Start Page. A close button is shown to its top right; clicking it removes the overlay from display. If a dashboard containing unsaved changes is displayed at invocation of Create New, an 'Are You Sure?' dialog is shown, from which you can:
-
Save the changes
-
Abandon the changes
-
Abandon creation of the new Dashboard
-
-
Open an existing Dashboard: invocation of this option displays the Open Dashboard File System Dialog. You can navigate accessible folders in the RPI file system to locate the dashboard that you wish to open. Only dashboard files are shown. Having located a dashboard, you can click OK or double click it to display it in the Dashboard Designer. You can also click Cancel to close the File System Dialog without opening a dashboard.
If a dashboard or containing unsaved changes are displayed, you can:
-
Save the changes
-
Abandon the changes
-
Abandon opening the dashboard
-
Save the current Dashboard: this option is disabled when no outstanding changes are present within the dashboard. If the dashboard has not been saved, Save behaves like Save As.... If dashboard has previously been saved, invocation of this option saves any dashboard changes to the existing dashboard file.
-
Save the current Dashboard as...: invocation of this option displays the Save Dashboard As… File System Dialog, allowing stipulation of the filename to which to save the new dashboard file.
Configuring a Dashboard’s Name
A dashboard’s name is configured in the large property shown at the top of the Dashboard Designer, below the toolbar:

Provision of a name is mandatory, and the value provided may be a maximum of 100 characters. The dashboard’s name is the same as the filename under which it is saved within the RPI file system. As such, it must be unique amongst the dashboards in the folder within which saved.
You can edit a dashboard’s name by clicking the property. Complete the edit by clicking off the property, or by hitting return.
Dashboard Validation
Before a dashboard or widget can be used, it must be valid.
A validation status indicator is displayed to the right of the dashboard’s name, and at certain widgets’ footers. When the dashboard or widget is valid and contains no validation errors, the validation status indicator is shown as follows:
Specific validation errors are outlined in the dashboard documentation. When one or more validation errors is present, a validation error indicator is shown:
Clicking the indicator lists the validation errors in a dialog:
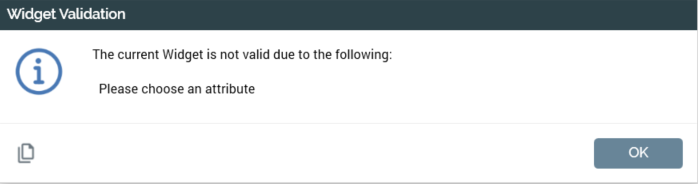
You can use the button at the bottom left of the dialog to copy the validation error details to the clipboard. You can close the dialog using the OK button.
Toolbox
The Dashboard Designer toolbox contains a the standard RPI Folder Search component, which is covered in the Framework documentation.
The toolbox is constrained to display only attribute, interaction, offer and selection rule files.