

Overview
The Dashboard provides activity tracking and analytics. It has the following tabs: Summary, Analytics, and Alerts.
A shared filter bar at the top of the page includes:
-
Search: A text input that filters the Activity Table by action, description, or user
-
Date Range Selector: Choose from preset ranges (10 Days, 30 Days, 1 Year) or select Custom Date to reveal a date range picker for specifying a custom period
-
Refresh button: Reload all data
Summary tab
The Summary tab shows operational KPIs and recent activity.
-
Metrics Carousel: A horizontally scrollable set of KPI cards. Each card displays:
-
An icon and title
-
A primary metric value
-
A change percentage with up/down indicator (green for improvement, red for decline)
-
A progress bar
-
A secondary metric label and value
-
Use the left/right arrows or pagination dots to navigate through the carousel. The metrics shown differ based on the selected role filter.
-
Activity Table: A paginated table showing recent system activities:
|
Column |
Description |
|---|---|
|
Type |
Icon indicating activity category |
|
Action |
Description of the action (e.g., "Run Production", "Create Experiment") |
|
Description |
Detailed message about the activity |
|
Job Type |
Color-coded badge: Production (blue), Experiment (amber), or System (gray) |
|
User |
The user who performed the action, or "System" |
|
Time Started |
Formatted timestamp |
The table is paginated with 10 rows per page.
Analytics tab
The Analytics tab has two display modes that switch automatically based on the selected date filter:
-
"All" selected: A static snapshot view shows aggregate metrics in card form.
-
Specific date range selected: A time-series chart view replaces the cards, showing metric trends over the selected period.
Static snapshot view
When "All" is selected, the Analytics tab provides detailed quality and performance metrics organized into four sections:
-
Match Metrics: Two cards showing Individual and Household match statistics:
-
Match penetration percentage (with trend indicator)
-
Total match groups
-
Records in groups
-
Singleton records (unmatched)
-
-
Performance: Three cards showing runtime metrics:
-
Hygiene Runtime (seconds)
-
Full Match Runtime (seconds)
-
Incremental Match Runtime (seconds)
-
Each card shows the runtime value, record count processed, and change percentage from the previous period.
-
Data Quality: Cards organized into three groups:
-
Population: Percentage of records with data for each field type (Name, Date of Birth, Address, Email, Phone, Social, Account, Other)
-
Alternates: Percentage of records with multiple values per field
-
Standardization: Address coding, address normalization, and name normalization percentages
-
-
User Review Statistics: A table showing per-user review activity with total reviewed count and average per day.
Time-series chart view
When a specific date range or custom date range is selected, the Analytics tab shows trend charts for the same metrics over time, allowing you to visualize how match quality, performance, and data quality have changed across production runs.
Alerts tab
The Alerts tab displays system-generated notifications that require attention. Alerts are generated when operational thresholds are exceeded (e.g., record count limits, international address limits, or license expiry).
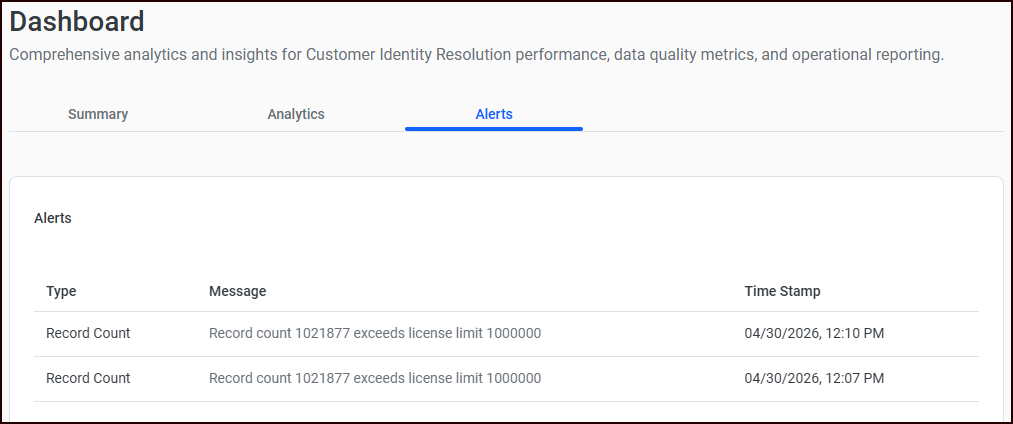
Alerts table: A sortable, virtual-scrolled table with the following columns:
|
Column |
Description |
|---|---|
|
Type |
Alert category (e.g., Record Count, International Address Count, License Expired) |
|
Message |
Detailed description of the alert |
|
Timestamp |
When the alert was generated |
Click any column header to sort by that column.
States:
-
Loading: A loader is displayed while alerts are being fetched.
-
Empty: A message indicating no alerts exist is shown when the alert list is empty.
Alerts also appear in the “notification bell” in the application header. Clicking "View Alerts" in the notification bell popover navigates directly to this tab.