Overview
Changes to Project settings will override the default Site Settings and Machine Settings for that project only. Most of the time, you should accept the default Site and Machine settings. However, you may find it useful to tune memory usage or JVM memory with certain kinds of projects. The Use record limit control lets you limit the number of records processed by the project, which can be useful for development and testing of projects. You may also want to turn on logging for the project, or configure the trace level setting of the server debug log.
To configure the memory settings for a project
-
Open the project.
-
Choose Settings from the Project menu.
-
On the Properties pane, select the Settings tab.
-
Locate the TUNING section.
-
Select Override, and then define Memory limit in megabytes. The default setting tends to produce reasonable results no matter which server is used. For special cases, such as a project with multiple sorts or joins and highly-parallel CASS/DPV/Lacslink/Geocoding, you may need to tune memory use very precisely.
-
Choose a Memory aggression setting. A good approach is to raise this number until you start getting warnings, and back off from there.
-
Lower numbers are conservative, saving memory for tools that might need it later. Set a lower number if a project produces warnings about tools getting less memory than requested.
-
Higher numbers attempt to dole out all memory quickly, which performs well unless later tools get "starved". Set a higher number to optimize the performance of Sort and Join tools within a small project.
-
-
Depending on your system configuration and the kind of project you are running, you may want to increase the default Sort parallelism setting. See Enabling sort parallelism.
-
Optionally, you may select Enable hidden Data Viewers. By default, Data Viewer tools in projects and macros that are embedded in other projects are disabled when the project is run.
-
If your project contains a large number of Java tools or tools that use a lot of JVM memory, you may want to increase the amount of JVM memory from the default setting of 200MB. Locate the JVM settings section, select Override site-level settings, and then enter the desired amount of memory. See About JVM memory for guidance.
To configure server debug verbosity for a project
-
Open the project.
-
Choose Settings from the Project menu.
-
On the Properties pane, select the Settings tab.
-
Locate the Server debug logs section.
-
Select Override, and enter a Trace level other than the default
1. Higher trace levels produce more verbose logging.
To configure logging for a project
-
Open the project.
-
Choose Settings from the Project menu.
-
On the Properties pane, select the Settings tab.
-
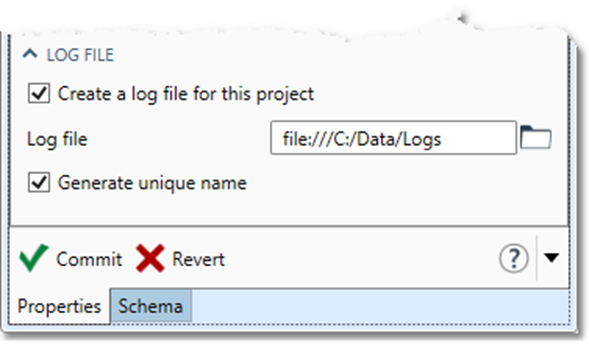
Locate the Log file section.
-
Select Create a log file for this project and browse to the location where the log file is to be created.
-
Either specify a file name for the log, or select Generate unique name to generate a file name based on the project name and time stamp.

Memory usage
The amount of memory required by a Data Management project will vary depending on the tools used within the project.
|
Tool name |
Minimum memory required |
Maximum memory that can be used |
Notes |
|---|---|---|---|
|
CASS (USA Standardize Address), no Processing options enabled |
40MB |
175MB |
Not shared between tool instances. |
|
CASS, Cycle O module |
400MB |
400MB |
Projects whose Standardize Address or AO Address Quality tools enable Delivery Point Validation (DPV) require an additional 400MB of project memory compared to the Cycle N CASS module. This is due to the addition of new DPV hash files, which must be loaded into memory.
|
|
CASS, DPV option |
250MB |
250MB |
Shared between identical tool instances. |
|
CASS, Suitelink option |
220MB |
220MB |
Shared between identical tool instances. |
|
CASS, LACSLink option |
220MB |
220MB |
Shared between identical tool instances. |
|
40MB |
175MB |
Not shared between tool instances. |
|
|
Flexible |
Flexible |
Will use variable amounts of memory based on the number of other tools requesting memory, and the Memory aggression setting. Not shared between tool instances. |
|
|
Total size of input table or lookup table |
Total size of input table or lookup table |
Size of input table or lookup table may be hard to predict, but you can see the amount of memory actually used by running a project and zooming the view to 200%. Not shared between tool instances. |
You should configure enough memory for a project to:
-
Satisfy the minimum memory requirements for all tools.
-
Provide enough memory for good performance.
For example, a project with three identically-configured CASS tools and DPV/Suitelink enabled will need at least 590MB of memory:
3 x CASS = 120MB
DPV = 250MB
SuiteLink = 220MB
Min total = 590MB
The maximum amount of memory these tools can use is:
3 x CASS = 525MB
DPV = 250MB
SuiteLink = 220MB
Min total = 995MB
Memory and performance
Each tool that sorts data (Sort, Join, Rank, Summarize, Pair to Group) benefits from memory that is at least 10% of the size of the data to be processed. The amount of memory needed is multiplied by the number of simultaneously active data-sorting tools.
Macros, especially matching macros, may also contain many data-sorting tools.
The number of data-sorting tools that are simultaneously active may be difficult to determine. Generally, if the tools are all connected end-to-end, that number is low (because one tool must finish processing before the next one starts). If the tools are connected “wide” with a lot of parallelism, that number is higher.

