

Overview
The Server Log tab is used to access details of server log messages generated at all clients across the cluster.
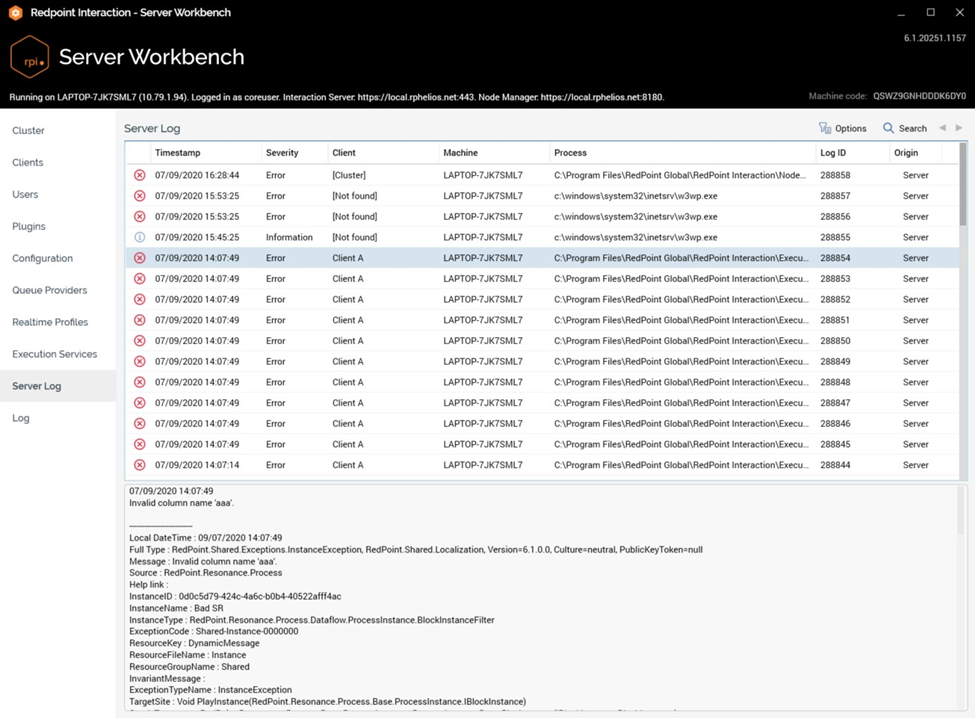
It consists of a Server Log and selected log message sections.
Server Log Section
The server log section contains a toolbar and grid
Server Log Toolbar
The Server Log toolbar exposes the following options:
-
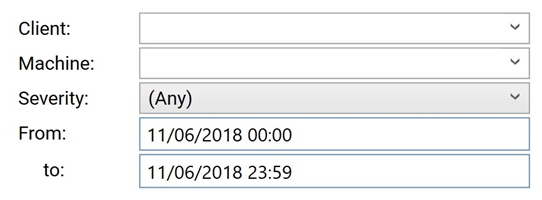
Options: clicking this button displays a dialog with the following options:
-
Client: dropdown, default blank. All clients configured at the cluster are listed.
-
Machine: dropdown, default blank. All machines within the current cluster are listed.
-
Severity: dropdown, values (Any) (the default), Critical, Error, Information, Warning.
-
From: defaults to today 00:00.
-
to: defaults to today 23:59.
-
-
Search: invocation refreshes the grid with log messages matching the current Options and removes the Options dialog if displayed.
-
Previous page: enabled when a previous page's worth of data is available. Invocation displays the same.
-
Next page: enabled when a next page's worth of data is available. Invocation displays the same.
Server Log Grid
The Server Log grid lists server log messages that match the currently-specified options. The size of a page within the grid is hard-coded to 100 records.
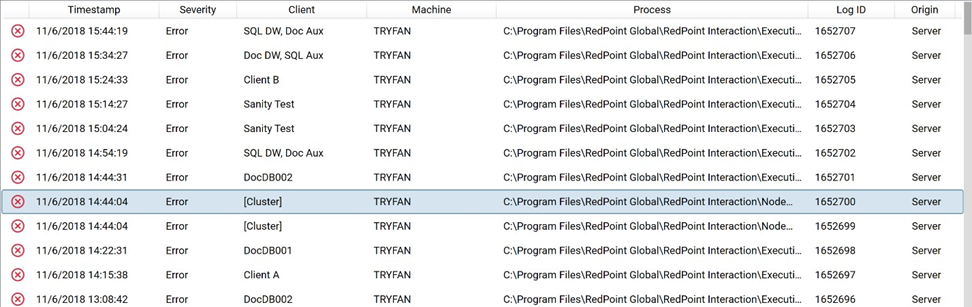
The following read-only columns are displayed:
-
Icon
-
Timestamp
-
Severity
-
Client
-
Machine
-
Process
-
Log ID
-
Origin: Server or Client
If no log messages are displayed, a message advises that ‘No log messages were returned based on the current search criteria’. Log messages are displayed in descending Timestamp order.
Selected Log Message Section
The read-only section below the grid displays full details of the currently-selected log message.