

Overview
The Execution tab is used to execute a data project. Specifically, it is used to validate and load a data project’s initial file, and upload, validate and load a data project’s second or subsequent files.
The Execution tab is displayed at a new data project once a file has been uploaded and analyzed.
Execution of a data project is carried out in two or three steps, depending on whether the initial or a subsequent file is being processed:
-
Acquisition: only relevant if processing the data project’s second, or a subsequent, file
-
Validation
-
Load
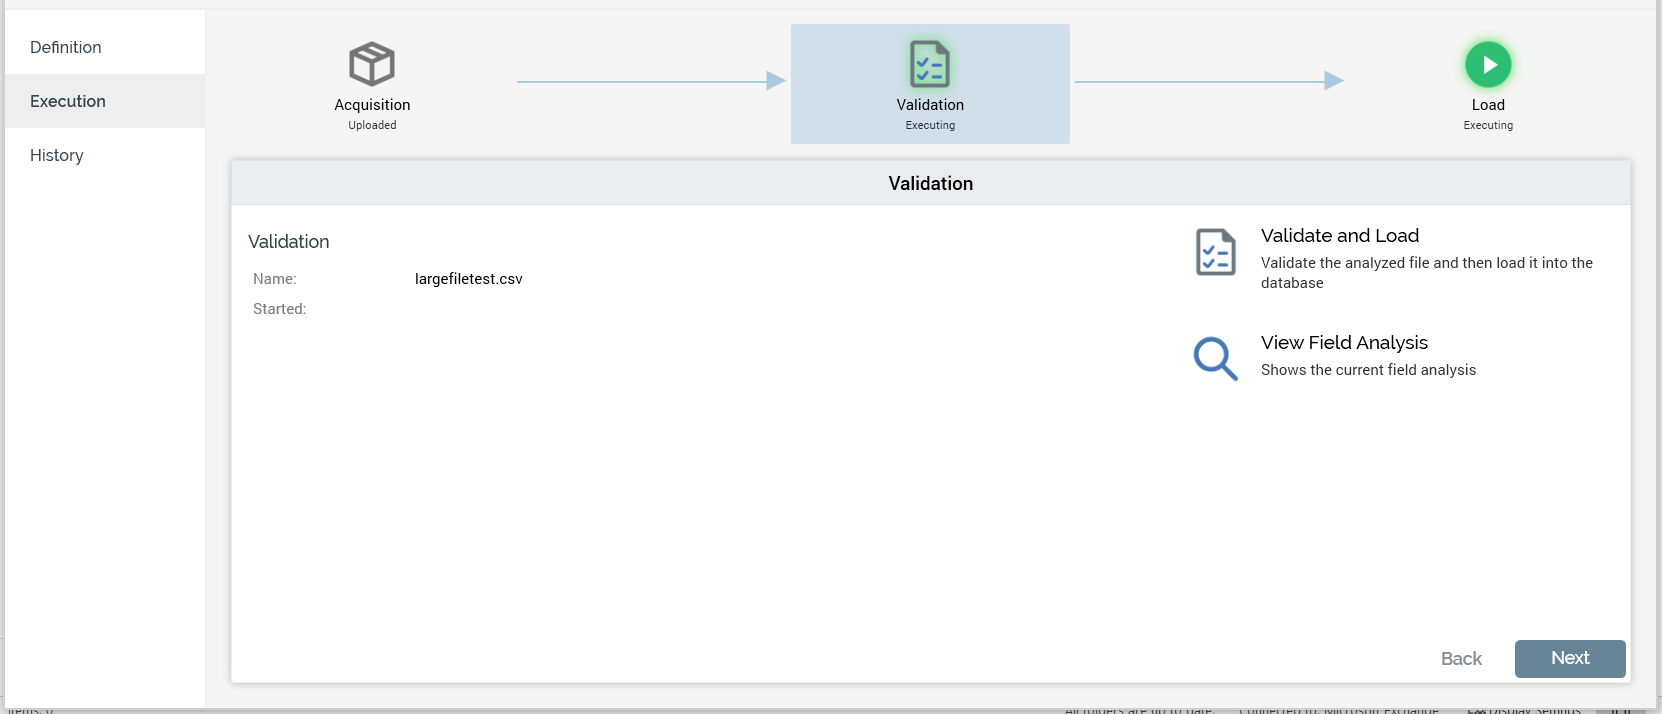
Each step is illustrated using an icon shown at the top of the Execution tab. Each icon corresponds to a separate panel that occupies the body of the tab.
Note that the Definition tab is still available when working in Execution. However, once a data project is established following load of its initial file, its definition may not be changed.
Navigation within the Execution tab is handled differently depending on whether the initial data project file is being processed.
-
If the initial file is being processed, navigation is carried out manually, as per the Definition tab.
-
If the second or a subsequent file is being processed, manual navigation between tabs is not usually required, should execution prove trouble free. As soon as you upload a file, validation and load are carried out seamlessly. Only in cases where validation or load failures occur is manual intervention required.
The current process step’s icon is selected. Status information is provided at each process step. This information is both graphical, via provision of a halo around the icon representing:
-
Green: the process step is currently in progress
-
Red: the process step has failed
-
Amber: the process step is in a waiting state
-
No halo: the process step has either not yet started or is complete.
…and verbal, via provision of a description of the step’s current status. Relevant statuses are listed below:
-
Execution - Acquisition
-
File Not Uploaded
-
Uploading
-
Upload Failed
-
Uploaded
-
-
Execution - Validation
-
Not Validated
-
Waiting to Validate
-
Validating
-
Validation Complete
-
Validation Failed
-
-
Execution - Load
-
Not Loaded
-
Waiting to Load
-
Loading
-
Loaded
-
Load Failed
-
Irrespective of whether processing the initial or a subsequent file, you can always choose to navigate between panels by clicking on icons. You can also use the Back and Next buttons displayed to the bottom right of each panel.
Execution Tab – Acquisition Panel
The Execution tab’s Acquisition panel is only used when processing a second or subsequent data project file. It is used to manually start the acquisition of a new file, and to locate the file to be uploaded, validated and loaded.
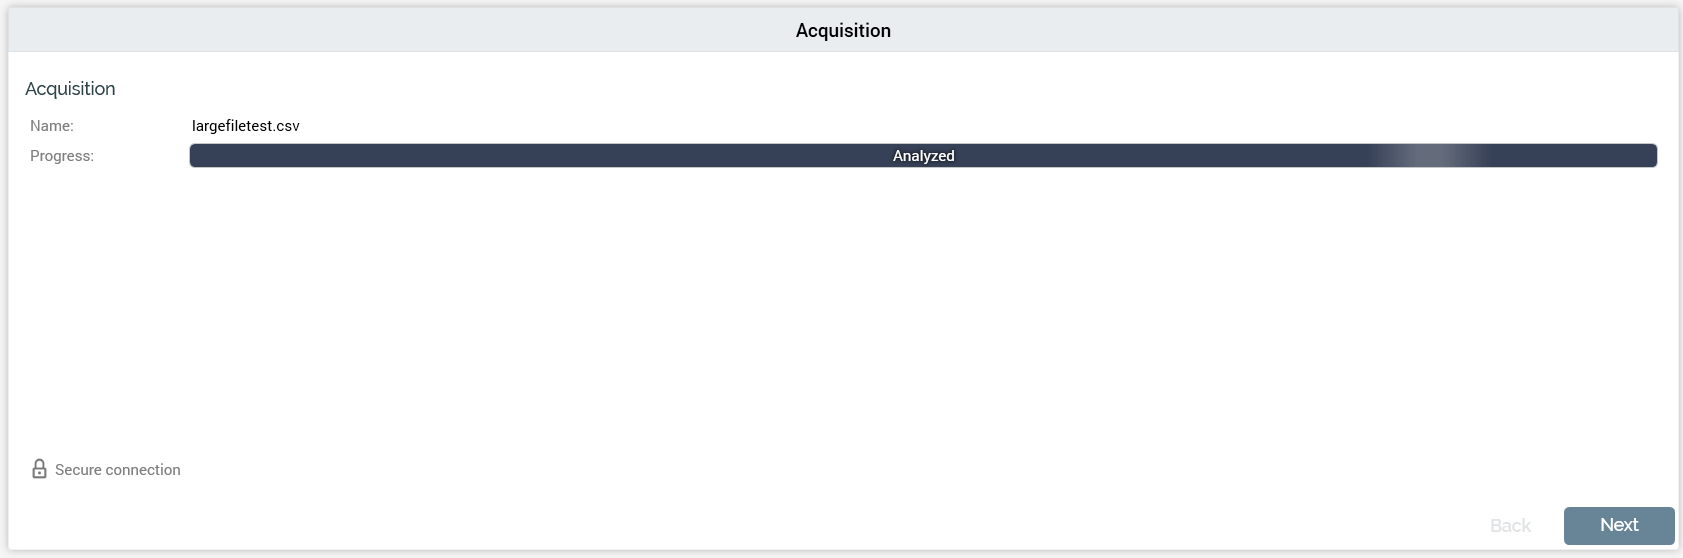
The Acquisition panel consists of the following elements:
Acquisition Section
This section shows details of the data project’s most recently-processed file. It contains:
-
Name: a read-only representation of the name of the current or most recently-acquired file.
-
Progress: this section contains a progress bar that is populated during the compression and upload processes. The progress bar provides a visual indication as to the current stage within the process
-
The fact that upload is carried out using a secure connection is confirmed via a padlock icon and “Secure Connection” label.
Actions Panel
The Actions panel is shown to the right.
The panel contains the following button, which is enabled or disabled in accordance with the current status of the data project:
Upload, validate and load: this button initiates the following activities:
A Windows file system dialog is displayed, within which you can locate a file to upload. By default, only text files (*.txt, *.csv) are shown. You can change the default filter to display compressed files (*.zip, *.rar, *.7z), or all files.
As soon as you select a file and click Open, the upload process begins.
If the selected file is a text file, RPI performs a quick analysis of 100 of the file’s rows. This “sanity check” is used to determine whether the file appears to be legitimately delimited or fixed-width. Following the sanity check, a sample of 20 records from the file is displayed in the File Upload Preview dialog.
The sanity check results are shown as follows:
-
If the file is delimited or fixed-width: “No major issues were found with this file”.
-
If RPI was unable to identify the file as delimited or fixed-width: “It is not recommended that you upload this file as the file type could not be determined”.
-
If an error occurred during analysis: “An unexpected error occurred while analyzing the file”.
Based on the information at your disposal, you can then invoke Start or Cancel Upload (note that you can still proceed with upload if RPI failed to identify the file’s type).
If you elect to proceed, the file is compressed before uploading, and decompressed on the server when fully uploaded. The Compress file and Decompress file progress checkpoints are updated accordingly. During compression, the progress bar is updated, and the legend “Compressed [x] bytes out of [y]” is shown.
If the selected file is compressed, RPI proceeds without showing a preview of the file (note that RPI supports the following compressed file types: .7z, .gz, .pkg, .rar, .sit, .sitx, .zip and .zipx). The following message is displayed at the Compress file progress checkpoint: “File already compressed; no further compression needed”.
You can upload both unprotected and password-protected compressed files (RPI decrypts using the password value stored in system configuration setting ZipPassword; if the password is incorrect, the Acquisition process step’s status becomes Upload Failed).
For unknown file types RPI displays a message indicating that the file extension was not recognized and it is likely that analysis will fail. You are still at liberty to proceed with uploading the file if you so choose.
The file is uploaded from your local file system or network, via a secure link, to a folder on the RPI server defined by system configuration setting DataIntakeLandingDirectory.
If you attempt to upload a file with a size larger than the maximum permitted (as defined by system configuration setting MaximumDirectUploadFileSize), a warning message is displayed and you are unable to upload the file.
-
The file is validated against the data project’s definition. If either of the validation thresholds (soft or hard) are breached, you can view details of the validation failures in the Validation panel. Note that if the hard threshold is breached you cannot proceed with loading the file.
-
The file is loaded into the database table that was created during data project definition.
Cancel current upload: causes cessation of the current upload.
Navigation Buttons
The navigation buttons provide an alternative way of navigating through the wizard-style sequence of data project execution process steps. They are displayed at the bottom right of the panel.
In the Execution tab’s Acquisition panel, the Back button is disabled, as the panel represents the first stage in the execution process. Clicking Next displays the Validation panel.
Execution Tab – Validation Panel
The Execution tab’s Validation panel is shown automatically following invocation of Validate when defining a data project.
It is not automatically displayed during the data project’s second or subsequent file execution. Rather, it only becomes relevant if errors occur during file validation. It may, however, be accessed manually at any point when the Execution tab is displayed.
The Validation panel consists of the following elements:
Validation
This section is shown when the current file is being or is about to be validated. It contains the following read-only fields:
-
Name: the name of the file being validated
-
Started: the date and time at which validation started
Validation Results
This section is shown when the current file validation is complete. It contains the following read-only fields:
-
Total rows: the number of rows within the file
-
Processed: the number of rows actually validated
-
Validated successfully: the number of rows that passed validation
-
Validation failures: the number of rows that failed validation, details of which are shown in the section below
Details
This is a read-only grid that lists individual validation errors. It contains the following columns:
-
Row: the number of the row in the file where the validation error occurred
-
Field Name: name of the field within which the validation error occurred
-
Message: details of the validation failure
You can page through validation failure details, 50 records at a time.
Breached Validation Thresholds
If the soft validation threshold (defined by system configuration setting WarningPercentValidationFailures) is breached, validation error details are displayed. You can proceed with loading the file; however, any invalid rows are not loaded.
If the hard validation threshold (defined by system configuration setting MaximumPercentValidationFailures) is breached, the Validation panel assumes the Validation Failed status. You cannot proceed with loading the file.
Actions Panel
The Actions panel is shown to the right.
It contains the following button, which is enabled as appropriate:
View Field Analysis: clicking this button displays the Field Analysis panel in the Definition tab.
Navigation Buttons
The navigation buttons provide an alternative way of navigating through the wizard-style sequence of data project execution process steps. They are displayed at the bottom right of the panel.
In the Execution tab’s Validation panel, clicking Back displays the Acquisition panel and clicking Next the Load panel.
Execution Tab – Load Panel
When defining a data project, you must navigate to the Execution tab’s Load panel manually following the initial file’s validation.
The Load panel is not automatically displayed during execution of a data project’s second or a subsequent file. It may, however, be accessed manually at any point when the Execution tab is shown.
The Load panel consists of the following elements:
Data Load Section
This read-only section displays details of the current or most recent data load.
It contains the following:
-
Drop table: this button allows you to initiate the dropping of the table associated with the data project. It is protected by an 'Are You Sure?' dialog. Clicking the button creates a Data project drop table job and displays it in the My Jobs Dialog. The job handles deletion of the table. After the table has been deleted, a check is performed prior to a subsequent data to ensure that the table is created again before the data project's execution.
-
Name: the name of the file
-
Started: the date and time at which the load started
Results
This section displays the results of loading a file. The following read-only results are shown:
-
Rows read
-
Rows filtered
-
Rows loaded
-
Rows updated
A Log of events that occurred during the load is displayed at the bottom of the Results section. A read-only list of log messages relating to the current data project file, is displayed in chronological order.
When errors occur during load, an orange advisory message is displayed above the Log. When you click the message, a context menu is displayed, exposing a single option:
Download...: selecting this option displays a Windows file system dialog to allow you to select a location to which to download the error file. By default, the file is named “Error log for [data project name].txt”. You can download the file to your local or network file system. Following successful download, an advisory message is displayed.
The error file’s structure is as follows:
-
Header
-
Error Message
-
Redpoint Data Management Job ID
-
Double-quoted, comma delimited list of fields in file
-
-
One entry per row not loaded, in a two-column, comma-separated format:
-
The first column contains the error message, including the line number where the error occurred.
-
The second column contains the full text of the input record in its original format.
-
Navigation Buttons
The navigation buttons provide an alternative way of navigating through the wizard-style sequence of data project execution process steps. They are displayed at the bottom right of the panel.
In the Execution tab’s Load panel, clicking Back displays the Validation panel. Next is disabled, as Load represents the final step in the execution process.